Chrysler 2015 Annual Report Download - page 146
Download and view the complete annual report
Please find page 146 of the 2015 Chrysler annual report below. You can navigate through the pages in the report by either clicking on the pages listed below, or by using the keyword search tool below to find specific information within the annual report.-
 1
1 -
2
-
3
-
4
-
5
-
6
-
7
-
8
-
9
-
10
-
11
-
12
-
13
-
14
-
15
-
16
-
17
-
18
-
19
-
20
-
21
-
22
-
23
-
24
-
25
-
26
-
27
-
28
-
29
-
30
-
31
-
32
-
33
-
34
-
35
-
36
-
37
-
38
-
39
-
40
-
41
-
42
-
43
-
44
-
45
-
46
-
47
-
48
-
49
-
50
-
51
-
52
-
53
-
54
-
55
-
56
-
57
-
58
-
59
-
60
-
61
-
62
-
63
-
64
-
65
-
66
-
67
-
68
-
69
-
70
-
71
-
72
-
73
-
74
-
75
-
76
-
77
-
78
-
79
-
80
-
81
-
82
-
83
-
84
-
85
-
86
-
87
-
88
-
89
-
90
-
91
-
92
-
93
-
94
-
95
-
96
-
97
-
98
-
99
-
100
-
101
-
102
-
103
-
104
-
105
-
106
-
107
-
108
-
109
-
110
-
111
-
112
-
113
-
114
-
115
-
116
-
117
-
118
-
119
-
120
-
121
-
122
-
123
-
124
-
125
-
126
-
127
-
128
-
129
-
130
-
131
-
132
-
133
-
134
-
135
-
 136
136 -
 137
137 -
 138
138 -
 139
139 -
 140
140 -
 141
141 -
 142
142 -
 143
143 -
 144
144 -
 145
145 -
 146
146 -
 147
147 -
 148
148 -
 149
149 -
 150
150 -
 151
151 -
 152
152 -
 153
153 -
 154
154 -
 155
155 -
 156
156 -
157
-
158
-
159
-
160
-
161
-
162
-
163
-
164
-
165
-
166
-
167
-
168
-
169
-
170
-
171
-
172
-
173
-
174
-
175
-
176
-
177
-
178
-
179
-
180
-
181
-
182
-
183
-
184
-
185
-
186
-
187
-
188
-
189
-
190
-
191
-
192
-
193
-
194
-
195
-
196
-
197
-
198
-
199
-
200
-
201
-
202
-
203
-
204
-
205
-
206
-
207
-
208
-
209
-
210
-
211
-
212
-
213
-
214
-
215
-
216
-
217
-
218
-
219
-
220
-
221
-
222
-
223
-
224
-
225
-
226
-
227
-
228
-
229
-
230
-
231
-
232
-
233
-
234
-
235
-
236
-
237
-
238
-
239
-
240
-
241
-
242
-
243
-
244
-
245
-
246
-
247
-
248
-
249
-
250
-
251
-
252
-
253
-
254
-
255
-
256
-
257
-
258
-
259
-
260
-
261
-
262
-
263
-
264
-
265
-
266
-
267
-
268
-
269
-
270
-
271
-
272
-
273
-
274
-
275
-
276
-
277
-
278
-
279
-
280
-
281
-
282
-
283
-
284
-
285
-
286
-
287
-
288
 |
 |

146 2015 | ANNUAL REPORT
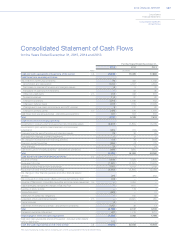
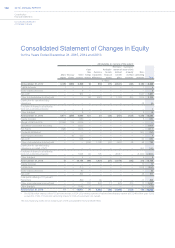
Consolidated
Financial Statements
Notes to the Consolidated
Financial Statements
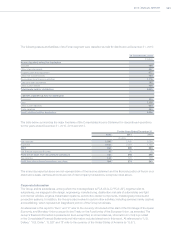
The principal exchange rates used to translate other currencies into Euro were as follows:
2015 2014 2013
Average At December 31, Average At December 31, Average At December 31,
U.S. Dollar 1.109 1.089 1.329 1.214 1.328 1.379
Brazilian Real 3.699 4.312 3.121 3.221 2.867 3.258
Chinese Renminbi 6.972 7.061 8.187 7.536 8.164 8.349
Canadian Dollar 1.418 1.512 1.466 1.406 1.368 1.467
Mexican Peso 17.611 18.915 17.657 17.868 16.960 18.073
Polish Zloty 4.184 4.264 4.184 4.273 4.197 4.154
Argentine Peso 10.271 14.136 10.782 10.382 7.263 8.988
Pound Sterling 0.726 0.734 0.806 0.779 0.849 0.834
Swiss Franc 1.068 1.084 1.215 1.202 1.231 1.228
Intangible assets
Goodwill
Goodwill represents the excess of the fair value of consideration paid over the fair value of net tangible and identifiable
intangible assets acquired in a business combination. Goodwill is not amortized, but is tested for impairment annually
or more frequently if events or changes in circumstances indicate that it might be impaired. After initial recognition,
Goodwill is measured at cost less any accumulated impairment losses.
Development costs
Development costs for vehicle project production and related components, engines and production systems are
recognized as an asset if both of the following conditions under IAS 38 – Intangible assets are met: that development
costs can be measured reliably and that the technical feasibility of the product, volumes and pricing support the view
that the development expenditure will generate future economic benefits. Capitalized development costs include all
direct and indirect costs that may be directly attributed to the development process.
Capitalized development costs are amortized on a straight-line basis from the beginning of production over the
expected life cycle of the models (generally 5-6 years) or powertrains developed (generally 10-12 years). All other
development costs are expensed as incurred.
Intangible assets with indefinite useful lives
Intangible assets with indefinite useful lives consist principally of brands which have no legal, contractual, competitive,
economic, or other factors that limit their useful lives.Intangible assets with indefinite useful lives are not amortized, but
are tested for impairment annually, or more frequently whenever there is an indication that the asset may be impaired,
by comparing the carrying amount with the recoverable amount.
Property, plant and equipment
Cost
Property, plant and equipment is initially recognized at cost and includes the purchase price, any costs directly
attributable to bringing the assets to the location and condition necessary to be capable of operating in the manner
intended by management and any initial estimate of the costs of dismantling and removing the item and restoring
the site on which it is located. Self-constructed assets are initially recognized at production cost. Subsequent
expenditures and the cost of replacing parts of an asset are capitalized only if they increase the future economic
benefits embodied in that asset. All other expenditures are expensed as incurred. When such replacement costs are
capitalized, the carrying amount of the parts that are replaced is recognized in the Consolidated Income Statement.