Chrysler 2015 Annual Report Download - page 202
Download and view the complete annual report
Please find page 202 of the 2015 Chrysler annual report below. You can navigate through the pages in the report by either clicking on the pages listed below, or by using the keyword search tool below to find specific information within the annual report.-
 1
1 -
2
-
3
-
4
-
5
-
6
-
7
-
8
-
9
-
10
-
11
-
12
-
13
-
14
-
15
-
16
-
17
-
18
-
19
-
20
-
21
-
22
-
23
-
24
-
25
-
26
-
27
-
28
-
29
-
30
-
31
-
32
-
33
-
34
-
35
-
36
-
37
-
38
-
39
-
40
-
41
-
42
-
43
-
44
-
45
-
46
-
47
-
48
-
49
-
50
-
51
-
52
-
53
-
54
-
55
-
56
-
57
-
58
-
59
-
60
-
61
-
62
-
63
-
64
-
65
-
66
-
67
-
68
-
69
-
70
-
71
-
72
-
73
-
74
-
75
-
76
-
77
-
78
-
79
-
80
-
81
-
82
-
83
-
84
-
85
-
86
-
87
-
88
-
89
-
90
-
91
-
92
-
93
-
94
-
95
-
96
-
97
-
98
-
99
-
100
-
101
-
102
-
103
-
104
-
105
-
106
-
107
-
108
-
109
-
110
-
111
-
112
-
113
-
114
-
115
-
116
-
117
-
118
-
119
-
120
-
121
-
122
-
123
-
124
-
125
-
126
-
127
-
128
-
129
-
130
-
131
-
132
-
133
-
134
-
135
-
136
-
137
-
138
-
139
-
140
-
141
-
142
-
143
-
144
-
145
-
146
-
147
-
148
-
149
-
150
-
151
-
152
-
153
-
154
-
155
-
156
-
157
-
158
-
159
-
160
-
161
-
162
-
163
-
164
-
165
-
166
-
167
-
168
-
169
-
170
-
171
-
172
-
173
-
174
-
175
-
176
-
177
-
178
-
179
-
180
-
181
-
182
-
183
-
184
-
185
-
186
-
187
-
188
-
189
-
190
-
191
-
 192
192 -
 193
193 -
 194
194 -
 195
195 -
 196
196 -
 197
197 -
 198
198 -
 199
199 -
 200
200 -
 201
201 -
 202
202 -
 203
203 -
 204
204 -
 205
205 -
 206
206 -
 207
207 -
 208
208 -
 209
209 -
 210
210 -
 211
211 -
 212
212 -
213
-
214
-
215
-
216
-
217
-
218
-
219
-
220
-
221
-
222
-
223
-
224
-
225
-
226
-
227
-
228
-
229
-
230
-
231
-
232
-
233
-
234
-
235
-
236
-
237
-
238
-
239
-
240
-
241
-
242
-
243
-
244
-
245
-
246
-
247
-
248
-
249
-
250
-
251
-
252
-
253
-
254
-
255
-
256
-
257
-
258
-
259
-
260
-
261
-
262
-
263
-
264
-
265
-
266
-
267
-
268
-
269
-
270
-
271
-
272
-
273
-
274
-
275
-
276
-
277
-
278
-
279
-
280
-
281
-
282
-
283
-
284
-
285
-
286
-
287
-
288
 |
 |

202 2015 | ANNUAL REPORT
Consolidated
Financial Statements
Notes to the Consolidated
Financial Statements
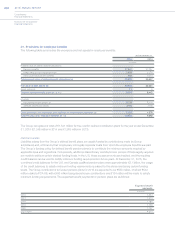
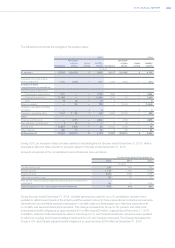
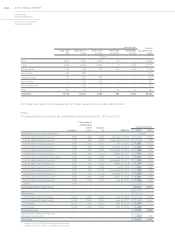
21. Provisions for employee benefits
The following table summarizes the provisions and net assets for employee benefits:
At December 31,
2015 2014
(€ million)
Present value of defined benefit obligations:
Pension benefits 27,547 27,287
Health care and life insurance plans 2,459 2,276
Other post-employment benefits 969 1,074
Total present value of defined benefit obligations (a) 30,975 30,637
Fair value of plan assets (b) 22,415 22,231
Asset ceiling (c) 11 6
Total net defined benefit plans (a - b + c) 8,571 8,412
of which:
Net defined benefit liability (d) 8,738 8,516
(Defined benefit plan asset) (167) (104)
Other provisions for employees and liabilities for share-based payments (e) 1,326 1,076
Total Provisions for employee benefits (d + e) 10,064 9,592
The Group recognized a total of €1,541 million for the cost for defined contribution plans for the year ended December
31, 2015 (€1,346 million in 2014 and €1,263 million in 2013).
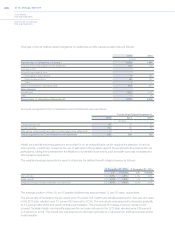
Pension benefits
Liabilities arising from the Group’s defined benefit plans are usually funded by contributions made by Group
subsidiaries and, at times by their employees, into legally separate trusts from which the employee benefits are paid.
The Group’s funding policy for defined benefit pension plans is to contribute the minimum amounts required by
applicable laws and regulations. Occasionally, additional discretionary contributions in excess of these legally required
are made to achieve certain desired funding levels. In the U.S. these excess amounts are tracked, and the resulting
credit balance can be used to satisfy minimum funding requirements in future years. At December31, 2015, the
combined credit balances for the U.S. and Canada qualified pension plans were approximately €2.1 billion, the usage
of the credit balances to satisfy minimum funding requirements is subject to the plans maintaining certain funding
levels. The Group contributions to funded pension plans for 2016 are expected to be €563 million, of which €542
million relate to FCA US, with €408 million being discretionary contributions and €134 million will be made to satisfy
minimum funding requirements. The expected benefit payments for pension plans are as follows:
Expectedbenefit
payments
(€million)
2016 1,854
2017 1,810
2018 1,785
2019 1,766
2020 1,747
2021-2025 8,573