Chrysler 2015 Annual Report Download - page 62
Download and view the complete annual report
Please find page 62 of the 2015 Chrysler annual report below. You can navigate through the pages in the report by either clicking on the pages listed below, or by using the keyword search tool below to find specific information within the annual report.-
 1
1 -
2
-
3
-
4
-
5
-
6
-
7
-
8
-
9
-
10
-
11
-
12
-
13
-
14
-
15
-
16
-
17
-
18
-
19
-
20
-
21
-
22
-
23
-
24
-
25
-
26
-
27
-
28
-
29
-
30
-
31
-
32
-
33
-
34
-
35
-
36
-
37
-
38
-
39
-
40
-
41
-
42
-
43
-
44
-
45
-
46
-
47
-
48
-
49
-
50
-
51
-
 52
52 -
 53
53 -
 54
54 -
 55
55 -
 56
56 -
 57
57 -
 58
58 -
 59
59 -
 60
60 -
 61
61 -
 62
62 -
 63
63 -
 64
64 -
 65
65 -
 66
66 -
 67
67 -
 68
68 -
 69
69 -
 70
70 -
 71
71 -
 72
72 -
73
-
74
-
75
-
76
-
77
-
78
-
79
-
80
-
81
-
82
-
83
-
84
-
85
-
86
-
87
-
88
-
89
-
90
-
91
-
92
-
93
-
94
-
95
-
96
-
97
-
98
-
99
-
100
-
101
-
102
-
103
-
104
-
105
-
106
-
107
-
108
-
109
-
110
-
111
-
112
-
113
-
114
-
115
-
116
-
117
-
118
-
119
-
120
-
121
-
122
-
123
-
124
-
125
-
126
-
127
-
128
-
129
-
130
-
131
-
132
-
133
-
134
-
135
-
136
-
137
-
138
-
139
-
140
-
141
-
142
-
143
-
144
-
145
-
146
-
147
-
148
-
149
-
150
-
151
-
152
-
153
-
154
-
155
-
156
-
157
-
158
-
159
-
160
-
161
-
162
-
163
-
164
-
165
-
166
-
167
-
168
-
169
-
170
-
171
-
172
-
173
-
174
-
175
-
176
-
177
-
178
-
179
-
180
-
181
-
182
-
183
-
184
-
185
-
186
-
187
-
188
-
189
-
190
-
191
-
192
-
193
-
194
-
195
-
196
-
197
-
198
-
199
-
200
-
201
-
202
-
203
-
204
-
205
-
206
-
207
-
208
-
209
-
210
-
211
-
212
-
213
-
214
-
215
-
216
-
217
-
218
-
219
-
220
-
221
-
222
-
223
-
224
-
225
-
226
-
227
-
228
-
229
-
230
-
231
-
232
-
233
-
234
-
235
-
236
-
237
-
238
-
239
-
240
-
241
-
242
-
243
-
244
-
245
-
246
-
247
-
248
-
249
-
250
-
251
-
252
-
253
-
254
-
255
-
256
-
257
-
258
-
259
-
260
-
261
-
262
-
263
-
264
-
265
-
266
-
267
-
268
-
269
-
270
-
271
-
272
-
273
-
274
-
275
-
276
-
277
-
278
-
279
-
280
-
281
-
282
-
283
-
284
-
285
-
286
-
287
-
288
 |
 |

62 2015 | ANNUAL REPORT
Operating Results
Adjusted EBIT
2015 compared to 2014
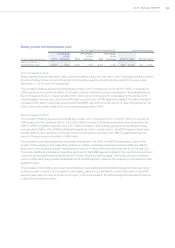
The decrease in APAC Adjusted EBIT in 2015 compared to 2014 was primarily attributable to (i) a negative impact of
€334 million related to the decrease in volumes as described above, (ii) unfavorable net pricing of €126 million, which
was partially offset by (iii) lower Selling, general and administrative costs of €72 million mainly as a result of reduced
advertising expense.
APAC Adjusted EBIT for the year ended December 31, 2015 excluded total charges of €205 million, of which €142
million related to the write-down of inventory (€53 million) and incremental incentives (€89 million) for vehicles affected
by the explosions at the Port of Tianjin.
2014 compared to 2013
The increase in APAC Adjusted EBIT in 2014 compared to 2013 was primarily attributable to (i) a positive volume/mix
impact of €494 million as a result of the increase in shipments described above, partially offset by (ii) an increase in
Selling, general and administrative costs of €111 million to support the growth of the APAC operations, (iii) an increase
in industrial costs of €52 million due to higher research and development costs, increased fixed manufacturing costs
for new product initiatives and higher production volumes and (iv) unfavorable pricing of €142 million due to the
increasingly competitive trading environment, particularly in China.
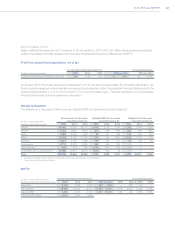
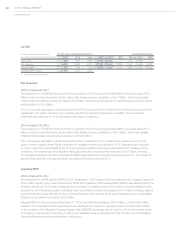
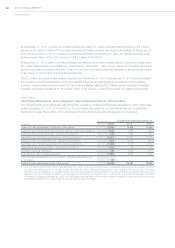
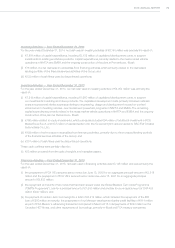
EMEA
(€ million, except percentages and
shipments which are in thousands of units)
For the Years Ended December 31, Increase/(decrease)
2015 2014 2013 2015 vs. 2014 CER 2014 vs. 2013 CER
Shipments 1,142 1,024 979 118 11.5% — 45 4.6% —
Net revenues 20,350 18,020 17,335 2,330 12.9% 10.9% 685 4.0% 3.7%
Adjusted EBIT 213 (41) (291) 254 n.m.(1) n.m.(1) 250 n.m.(1) n.m.(1)
Adjusted EBIT margin 1.0% (0.2)% (1.7)%
(1) Number is not meaningful.
Net revenues
2015 compared to 2014
The increase in EMEA Net revenues in 2015 compared to 2014 was primarily attributable to (i) a total positive impact
of €1.9 billion related to higher volumes and favorable product mix, (ii) positive net pricing of €0.1 billion, which was
mainly driven by pricing actions in non-European Union markets and (iii) favorable foreign exchange effects of €0.4
billion.
The 11.5 percent increase in vehicle shipments in 2015 compared to 2014 was largely driven by the Fiat 500 family
and the Jeep brand, specifically the all-new Fiat 500X and the all-new 2015 Jeep Renegade.
2014 compared to 2013
The increase in EMEA Net revenues in 2014 compared to 2013 was mainly attributable to the combination of (i) a
€0.6 billion increase in vehicle shipments, (ii) a €0.3 billion favorable sales mix impact primarily driven by Jeep brand
and LCV shipments, partially offset by (iii) unfavorable pricing of €0.1 billion due to the increasingly competitive trading
environment particularly related to passenger cars in Europe and (iv) €0.1 billion lower components sales.
The 4.6 percent increase in vehicle shipments in 2014 compared to 2013 was largely driven by the Fiat 500 family, the
Jeep brand (the all-new Renegade and Cherokee) and the new Fiat Ducato.