Chrysler 2015 Annual Report Download - page 205
Download and view the complete annual report
Please find page 205 of the 2015 Chrysler annual report below. You can navigate through the pages in the report by either clicking on the pages listed below, or by using the keyword search tool below to find specific information within the annual report.-
 1
1 -
2
-
3
-
4
-
5
-
6
-
7
-
8
-
9
-
10
-
11
-
12
-
13
-
14
-
15
-
16
-
17
-
18
-
19
-
20
-
21
-
22
-
23
-
24
-
25
-
26
-
27
-
28
-
29
-
30
-
31
-
32
-
33
-
34
-
35
-
36
-
37
-
38
-
39
-
40
-
41
-
42
-
43
-
44
-
45
-
46
-
47
-
48
-
49
-
50
-
51
-
52
-
53
-
54
-
55
-
56
-
57
-
58
-
59
-
60
-
61
-
62
-
63
-
64
-
65
-
66
-
67
-
68
-
69
-
70
-
71
-
72
-
73
-
74
-
75
-
76
-
77
-
78
-
79
-
80
-
81
-
82
-
83
-
84
-
85
-
86
-
87
-
88
-
89
-
90
-
91
-
92
-
93
-
94
-
95
-
96
-
97
-
98
-
99
-
100
-
101
-
102
-
103
-
104
-
105
-
106
-
107
-
108
-
109
-
110
-
111
-
112
-
113
-
114
-
115
-
116
-
117
-
118
-
119
-
120
-
121
-
122
-
123
-
124
-
125
-
126
-
127
-
128
-
129
-
130
-
131
-
132
-
133
-
134
-
135
-
136
-
137
-
138
-
139
-
140
-
141
-
142
-
143
-
144
-
145
-
146
-
147
-
148
-
149
-
150
-
151
-
152
-
153
-
154
-
155
-
156
-
157
-
158
-
159
-
160
-
161
-
162
-
163
-
164
-
165
-
166
-
167
-
168
-
169
-
170
-
171
-
172
-
173
-
174
-
175
-
176
-
177
-
178
-
179
-
180
-
181
-
182
-
183
-
184
-
185
-
186
-
187
-
188
-
189
-
190
-
191
-
192
-
193
-
194
-
 195
195 -
 196
196 -
 197
197 -
 198
198 -
 199
199 -
 200
200 -
 201
201 -
 202
202 -
 203
203 -
 204
204 -
 205
205 -
 206
206 -
 207
207 -
 208
208 -
 209
209 -
 210
210 -
 211
211 -
 212
212 -
 213
213 -
 214
214 -
 215
215 -
216
-
217
-
218
-
219
-
220
-
221
-
222
-
223
-
224
-
225
-
226
-
227
-
228
-
229
-
230
-
231
-
232
-
233
-
234
-
235
-
236
-
237
-
238
-
239
-
240
-
241
-
242
-
243
-
244
-
245
-
246
-
247
-
248
-
249
-
250
-
251
-
252
-
253
-
254
-
255
-
256
-
257
-
258
-
259
-
260
-
261
-
262
-
263
-
264
-
265
-
266
-
267
-
268
-
269
-
270
-
271
-
272
-
273
-
274
-
275
-
276
-
277
-
278
-
279
-
280
-
281
-
282
-
283
-
284
-
285
-
286
-
287
-
288
 |
 |

2015 | ANNUAL REPORT 205
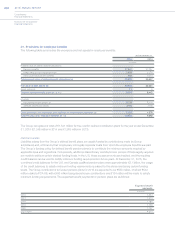
The investment strategies and objectives for pension assets primarily in the U.S. and Canada reflect a balance of liability-
hedging and return-seeking investment considerations. The investment objectives are to minimize the volatility of the
value of the pension assets relative to the pension liabilities and to ensure assets are sufficient to pay plan obligations.
The objective of minimizing the volatility of assets relative to liabilities is addressed primarily through asset diversification,
partial asset–liability matching and hedging. Assets are broadly diversified across many asset classes to achieve risk–
adjusted returns that, in total, lower asset volatility relative to the liabilities. Additionally, in order to minimize pension asset
volatility relative to the pension liabilities, a portion of the pension plan assets are allocated to fixed income securities. The
Group policy for these plans ensures actual allocations are in line with target allocations as appropriate.
Assets are actively managed, primarily, by external investment managers. Investment managers are not permitted
to invest outside of the asset class or strategy for which they have been appointed. The Group uses investment
guidelines to ensure investment managers invest solely within the mandated investment strategy. Certain investment
managers use derivative financial instruments to mitigate the risk of changes in interest rates and foreign currencies
impacting the fair values of certain investments. Derivative financial instruments may also be used in place of physical
securities when it is more cost effective and/or efficient to do so. Plan assets do not include shares of FCA or
properties occupied by Group companies, with the possible exception of comingled investment vehicles where FCA
does not control the investment guidelines.
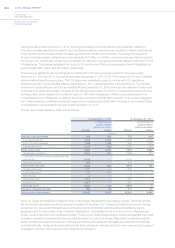
Sources of potential risk in the pension plan assets measurements relate to market risk, interest rate risk and operating
risk. Market risk is mitigated by diversification strategies and as a result, there are no significant concentrations of risk in
terms of sector, industry, geography, market capitalization, or counterparty. Interest rate risk is mitigated by partial asset–
liability matching. The fixed income target asset allocation partially matches the bond–like and long–dated nature of the
pension liabilities. Interest rate increases generally will result in a decline in the fair value of the investments in fixed income
securities and the present value of the obligations. Conversely, interest rate decreases generally will increase the fair value
of the investments in fixed income securities and the present value of the obligations.
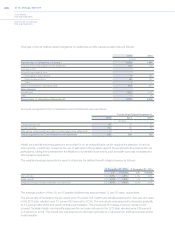
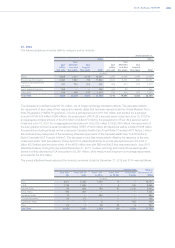
The weighted average assumptions used to determine the defined benefit obligations were as follows:
At December 31, 2015 At December 31, 2014
U.S. Canada UK U.S. Canada UK
Discount rate 4.5% 4.0% 3.8% 4.0% 3.8% 4.0%
Future salary increase rate —% 3.5% 2.9% —% 3.5% 3.0%
The average duration of the U.S. and Canadian liabilities was approximately 11 and 13 years, respectively. The
average duration of the UK pension liabilities was approximately 20 years.
Health care and life insurance plans
Liabilities arising from these plans comprise obligations for retiree health care and life insurance granted to employees
and to retirees in the U.S. and Canada by FCA US companies. Upon retirement from the Group, these employees may
become eligible for continuation of certain benefits. Benefits and eligibility rules may be modified periodically. These
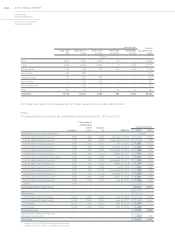
plans are unfunded. The expected benefit payments for unfunded health care and life insurance plans are as follows:
Expected
benefitpayments
(€ million)
2016 139
2017 139
2018 139
2019 139
2020 139
2021-2025 716