Chrysler 2015 Annual Report Download - page 164
Download and view the complete annual report
Please find page 164 of the 2015 Chrysler annual report below. You can navigate through the pages in the report by either clicking on the pages listed below, or by using the keyword search tool below to find specific information within the annual report.
164 2015 | ANNUAL REPORT
Consolidated
Financial Statements
Notes to the Consolidated
Financial Statements
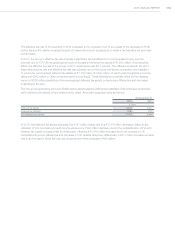
ACQUISITION OF THE REMAINING OWNERSHIP INTEREST IN FCA US
As of December31, 2013, FCA held a 58.5 percent ownership interest in FCA US and the UAW Retiree Medical
Benefits Trust, (the “VEBA Trust”) held the remaining 41.5 percent. On January1, 2014, FCA’s 100 percent owned
subsidiary FCA North America Holdings LLC, (“FCA NA”) and the VEBA Trust announced that they had entered into
an agreement (“the Equity Purchase Agreement”) under which FCA NA agreed to acquire the VEBA Trust’s 41.5
percent interest in FCA US, which included an approximately 10percent interest in FCA US subject to previously
exercised options that had been subject to ongoing litigation, for cash consideration of U.S.$3,650 million (€2,691
million) as follows:
a special distribution of U.S.$1,900 million (€1,404 million) paid by FCA US to its members, which served to fund a
portion of the transaction, wherein FCA NA directed its portion of the special distribution to the VEBA Trust as part
of the purchase consideration; and
an additional cash payment by FCA NA to the VEBA Trust of U.S.$1,750 million (€1.3billion).
The previously exercised options for approximately 10 percent interest in FCA US were historically carried at cost,
which was zero as the options were on shares that did not have a quoted market price in an active market and as
the interpretation of the formula required to calculate the exercise price on the options was disputed by the VEBA
Trust and had been subject to ongoing litigation. Upon consummation of the transactions contemplated by the Equity
Purchase Agreement, the fair value of the underlying equity and the estimated exercise price of the options, at that
point, became reliably estimable. As such, on the transaction date, the options were remeasured to their fair value of
U.S.$302 million (€223 million at the transaction date), which resulted in a corresponding non-taxable gain that was
recorded within Other income/(expenses).
The fair value of the options was calculated as the difference between the estimated exercise price for the disputed
options encompassed in the Equity Purchase Agreement of U.S.$650 million (€481 million) and the estimated fair
value for the underlying approximately 10 percent interest in FCA US of U.S.$952 million (€704 million). Management
had estimated the exercise price for the disputed options to be U.S.$650 million (€481 million at the transaction date)
representing the mid-point of the range between U.S.$600 million (€444 million at the transaction date) and U.S.$700
million (€518 million at the transaction date. Management believed this amount represented the appropriate point
estimate of the exercise price encompassed in the Equity Purchase Agreement.
Since there was no publicly observable market price for FCA US’s membership interests, the fair value as of the
transaction date of the approximately 10 percent non-controlling ownership interest in FCA US was determined
based on the range of potential values determined in connection with the IPO that FCA US was pursuing at the time
the Equity Purchase Agreement was negotiated and executed, which was corroborated by a discounted cash flow
valuation that estimated a value near the mid-point of the range of potential IPO values. Management concluded that
the mid-point of the range of potential IPO value provided the best evidence of the fair value of FCA US’s membership
interests at the transaction date as it reflects market input obtained during the IPO process, thus providing better
evidence of the price at which a market participant would transact consistent with IFRS 13 - Fair Value Measurement.
The potential IPO values for 100 percent of FCA US’s equity on a fully distributed basis ranged from $10.5 billion to
U.S.$12.0 billion (€7.6 billion to €8.7 billion at December 31, 2013). Management concluded the mid-point of this
range, U.S.$11.25 billion (€8.16 billion at December 31, 2013), was the best point estimate of fair value. The IPO value
range was determined using earnings multiples observed in the market for publicly traded U.S.-based automotive
companies. This fully distributed value was then reduced by approximately 15 percent for the expected discount that
would have been realized in order to complete a successful IPO for the minority interest being sold between a willing
buyer and a willing seller pursuant to the principles in IFRS 13 - Fair Value Measurement. This discount was estimated
based on certain factors that a market participant would have considered including the fact that Fiat intended on
remaining the majority owner of FCA US, that there was no active market for FCA US’s equity and that the IPO price
represents the creation of the public market, which would have taken time to develop into an active market.


