Chrysler 2015 Annual Report Download - page 177
Download and view the complete annual report
Please find page 177 of the 2015 Chrysler annual report below. You can navigate through the pages in the report by either clicking on the pages listed below, or by using the keyword search tool below to find specific information within the annual report.-
 1
1 -
2
-
3
-
4
-
5
-
6
-
7
-
8
-
9
-
10
-
11
-
12
-
13
-
14
-
15
-
16
-
17
-
18
-
19
-
20
-
21
-
22
-
23
-
24
-
25
-
26
-
27
-
28
-
29
-
30
-
31
-
32
-
33
-
34
-
35
-
36
-
37
-
38
-
39
-
40
-
41
-
42
-
43
-
44
-
45
-
46
-
47
-
48
-
49
-
50
-
51
-
52
-
53
-
54
-
55
-
56
-
57
-
58
-
59
-
60
-
61
-
62
-
63
-
64
-
65
-
66
-
67
-
68
-
69
-
70
-
71
-
72
-
73
-
74
-
75
-
76
-
77
-
78
-
79
-
80
-
81
-
82
-
83
-
84
-
85
-
86
-
87
-
88
-
89
-
90
-
91
-
92
-
93
-
94
-
95
-
96
-
97
-
98
-
99
-
100
-
101
-
102
-
103
-
104
-
105
-
106
-
107
-
108
-
109
-
110
-
111
-
112
-
113
-
114
-
115
-
116
-
117
-
118
-
119
-
120
-
121
-
122
-
123
-
124
-
125
-
126
-
127
-
128
-
129
-
130
-
131
-
132
-
133
-
134
-
135
-
136
-
137
-
138
-
139
-
140
-
141
-
142
-
143
-
144
-
145
-
146
-
147
-
148
-
149
-
150
-
151
-
152
-
153
-
154
-
155
-
156
-
157
-
158
-
159
-
160
-
161
-
162
-
163
-
164
-
165
-
166
-
 167
167 -
 168
168 -
 169
169 -
 170
170 -
 171
171 -
 172
172 -
 173
173 -
 174
174 -
 175
175 -
 176
176 -
 177
177 -
 178
178 -
 179
179 -
 180
180 -
 181
181 -
 182
182 -
 183
183 -
 184
184 -
 185
185 -
 186
186 -
 187
187 -
188
-
189
-
190
-
191
-
192
-
193
-
194
-
195
-
196
-
197
-
198
-
199
-
200
-
201
-
202
-
203
-
204
-
205
-
206
-
207
-
208
-
209
-
210
-
211
-
212
-
213
-
214
-
215
-
216
-
217
-
218
-
219
-
220
-
221
-
222
-
223
-
224
-
225
-
226
-
227
-
228
-
229
-
230
-
231
-
232
-
233
-
234
-
235
-
236
-
237
-
238
-
239
-
240
-
241
-
242
-
243
-
244
-
245
-
246
-
247
-
248
-
249
-
250
-
251
-
252
-
253
-
254
-
255
-
256
-
257
-
258
-
259
-
260
-
261
-
262
-
263
-
264
-
265
-
266
-
267
-
268
-
269
-
270
-
271
-
272
-
273
-
274
-
275
-
276
-
277
-
278
-
279
-
280
-
281
-
282
-
283
-
284
-
285
-
286
-
287
-
288
 |
 |

2015 | ANNUAL REPORT 177
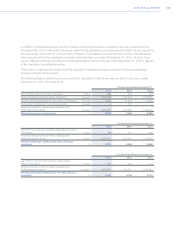
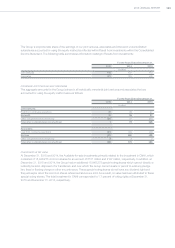
In addition, the weighted average number of shares outstanding has been increased to take into consideration the
theoretical effect that would arise if the shares related to the mandatory convertible securities (Note 19) were issued for
the years ended December 31, 2015 and 2014. Based on FCA’s share price, the minimum number of shares would
have been issued had the mandatory convertible securities been converted at December 31, 2015. As such, there
was no difference between the basic and diluted earnings per share for the year ended December 31, 2015 in respect
of the mandatory convertible securities.
There were no instruments excluded from the calculation of diluted earnings per share for the periods presented
because of an anti-dilutive impact.
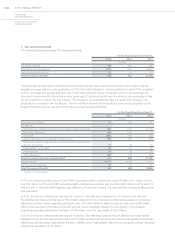
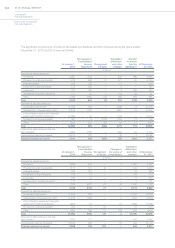
The following table provides the amounts used in the calculation of diluted earnings per share for the years ended
December31, 2015, 2014 and 2013:
For the Years Ended December 31,
2015 2014 2013
Net profit attributable to owners of the parent € million 334 568 904
Weighted average number of shares outstanding thousand 1,510,555 1,222,346 1,215,921
Number of shares deployable for share-based compensation thousand 3,452 11,204 13,005
Dilutive effect of Mandatory Convertible Securities thousand —547 —
Weighted average number of shares outstanding for
diluted earnings per share thousand 1,514,007 1,234,097 1,228,926
Diluted earnings per ordinary share €0.221 0.460 0.736
For the Years Ended December 31,
2015 2014 2013
Net profit from continuing operations attributable to owners
of the parent € million 83 327 690
Weighted average number of shares outstanding for
diluted earnings per share thousand 1,514,007 1,234,097 1,228,926
Diluted earnings per ordinary share from continuing
operations €0.055 0.265 0.562
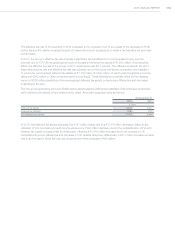
For the Years Ended December 31,
2015 2014 2013
Net profit from discontinued operations attributable to
owners of the parent € million 251 241 214
Weighted average number of shares outstanding for
diluted earnings per share thousand 1,514,007 1,234,097 1,228,926
Diluted earnings per ordinary share from discontinued
operations €0.166 0.195 0.174