Chrysler 2015 Annual Report Download - page 219
Download and view the complete annual report
Please find page 219 of the 2015 Chrysler annual report below. You can navigate through the pages in the report by either clicking on the pages listed below, or by using the keyword search tool below to find specific information within the annual report.-
 1
1 -
2
-
3
-
4
-
5
-
6
-
7
-
8
-
9
-
10
-
11
-
12
-
13
-
14
-
15
-
16
-
17
-
18
-
19
-
20
-
21
-
22
-
23
-
24
-
25
-
26
-
27
-
28
-
29
-
30
-
31
-
32
-
33
-
34
-
35
-
36
-
37
-
38
-
39
-
40
-
41
-
42
-
43
-
44
-
45
-
46
-
47
-
48
-
49
-
50
-
51
-
52
-
53
-
54
-
55
-
56
-
57
-
58
-
59
-
60
-
61
-
62
-
63
-
64
-
65
-
66
-
67
-
68
-
69
-
70
-
71
-
72
-
73
-
74
-
75
-
76
-
77
-
78
-
79
-
80
-
81
-
82
-
83
-
84
-
85
-
86
-
87
-
88
-
89
-
90
-
91
-
92
-
93
-
94
-
95
-
96
-
97
-
98
-
99
-
100
-
101
-
102
-
103
-
104
-
105
-
106
-
107
-
108
-
109
-
110
-
111
-
112
-
113
-
114
-
115
-
116
-
117
-
118
-
119
-
120
-
121
-
122
-
123
-
124
-
125
-
126
-
127
-
128
-
129
-
130
-
131
-
132
-
133
-
134
-
135
-
136
-
137
-
138
-
139
-
140
-
141
-
142
-
143
-
144
-
145
-
146
-
147
-
148
-
149
-
150
-
151
-
152
-
153
-
154
-
155
-
156
-
157
-
158
-
159
-
160
-
161
-
162
-
163
-
164
-
165
-
166
-
167
-
168
-
169
-
170
-
171
-
172
-
173
-
174
-
175
-
176
-
177
-
178
-
179
-
180
-
181
-
182
-
183
-
184
-
185
-
186
-
187
-
188
-
189
-
190
-
191
-
192
-
193
-
194
-
195
-
196
-
197
-
198
-
199
-
200
-
201
-
202
-
203
-
204
-
205
-
206
-
207
-
208
-
 209
209 -
 210
210 -
 211
211 -
 212
212 -
 213
213 -
 214
214 -
 215
215 -
 216
216 -
 217
217 -
 218
218 -
 219
219 -
 220
220 -
 221
221 -
 222
222 -
 223
223 -
 224
224 -
 225
225 -
 226
226 -
 227
227 -
 228
228 -
 229
229 -
230
-
231
-
232
-
233
-
234
-
235
-
236
-
237
-
238
-
239
-
240
-
241
-
242
-
243
-
244
-
245
-
246
-
247
-
248
-
249
-
250
-
251
-
252
-
253
-
254
-
255
-
256
-
257
-
258
-
259
-
260
-
261
-
262
-
263
-
264
-
265
-
266
-
267
-
268
-
269
-
270
-
271
-
272
-
273
-
274
-
275
-
276
-
277
-
278
-
279
-
280
-
281
-
282
-
283
-
284
-
285
-
286
-
287
-
288
 |
 |

2015 | ANNUAL REPORT 219
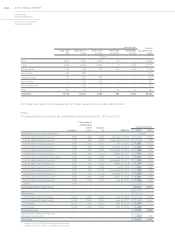
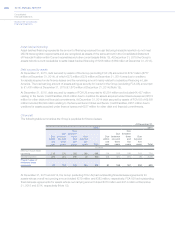
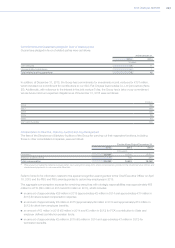
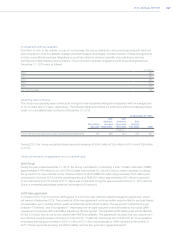
The following table provides a reconciliation of the changes in items measured at fair value and categorized as Level 3
at December 31, 2015 and December 31, 2014:
Othernon-current
securities
Otherfinancial
assets/(liabilities)
(€ million)
At January 1, 2014 12 2
Gains/(losses) recognized in Consolidated Income Statement —16
Gains/(losses) recognized in Other comprehensive income/(loss) —(8)
Issues/Settlements 10 (14)
At December 31, 2014 22 (4)
Gains/(losses) recognized in Consolidated Income Statement 1(14)
Gains/(losses) recognized in Other comprehensive income/(loss) —(39)
Transfer to Assets held for distribution (11) —
Issues/Settlements —22
At December 31, 2015 12 (35)
The gains/losses included in the Consolidated Income Statements are recognized within Cost of sales. Of the total
gains/(losses) recognized in Other comprehensive income/(loss), €37 million was reflected within cash flow reserves
and€2 million was reflected within currency translation differences.
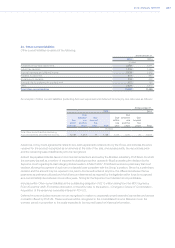
Assets and liabilities not measured at fair value on recurring basis
For financial instruments represented by short-term receivables and payables, for which the present value of
future cash flows does not differ significantly from carrying value, we assume that carrying value is a reasonable
approximation of the fair value. In particular, the carrying amount of Current receivables and Other current assets and
of Trade payables and Other current liabilities approximates their fair value.
Refer to Note 19 for a detailed discussion of the allocation of the fair value of the liability component of the Mandatory
Convertible Securities issued by FCA in December 2014.
Refer to the section —Changes in the Scope of Consolidation - Acquisition of the remaining ownership interest
in FCA US for a discussion of the residual value methodology used to determine the fair values of the acquired
elements in connection with the transactions related to the acquisition of the remaining 41.5 percent interest in FCA
US and the MOU.
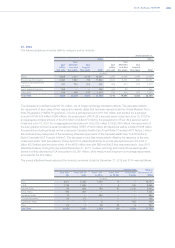
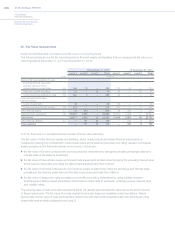
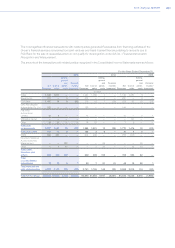
The following table provides the carrying amount and fair value for financial assets and liabilities not measured at fair
value on a recurring basis:
At December 31,
2015 2014
Carrying
amount
Fair
Value
Carrying
amount
Fair
Value
Note (€ million)
Dealer financing 1,650 1,649 2,313 2,312
Retail financing 238 232 1,039 1,032
Finance lease 8 8 349 351
Other receivables from financing activities 110 110 142 142
Receivables from financing activities (15) 2,006 1,999 3,843 3,837
Asset backed financing 206 206 469 469
Notes 13,441 14,120 17,648 18,794
Other debt 14,139 14,074 15,607 15,685
Debt (23) 27,786 28,400 33,724 34,948