Chrysler 2015 Annual Report Download - page 44
Download and view the complete annual report
Please find page 44 of the 2015 Chrysler annual report below. You can navigate through the pages in the report by either clicking on the pages listed below, or by using the keyword search tool below to find specific information within the annual report.-
 1
1 -
2
-
3
-
4
-
5
-
6
-
7
-
8
-
9
-
10
-
11
-
12
-
13
-
14
-
15
-
16
-
17
-
18
-
19
-
20
-
21
-
22
-
23
-
24
-
25
-
26
-
27
-
28
-
29
-
30
-
31
-
32
-
33
-
 34
34 -
 35
35 -
 36
36 -
 37
37 -
 38
38 -
 39
39 -
 40
40 -
 41
41 -
 42
42 -
 43
43 -
 44
44 -
 45
45 -
 46
46 -
 47
47 -
 48
48 -
 49
49 -
 50
50 -
 51
51 -
 52
52 -
 53
53 -
 54
54 -
55
-
56
-
57
-
58
-
59
-
60
-
61
-
62
-
63
-
64
-
65
-
66
-
67
-
68
-
69
-
70
-
71
-
72
-
73
-
74
-
75
-
76
-
77
-
78
-
79
-
80
-
81
-
82
-
83
-
84
-
85
-
86
-
87
-
88
-
89
-
90
-
91
-
92
-
93
-
94
-
95
-
96
-
97
-
98
-
99
-
100
-
101
-
102
-
103
-
104
-
105
-
106
-
107
-
108
-
109
-
110
-
111
-
112
-
113
-
114
-
115
-
116
-
117
-
118
-
119
-
120
-
121
-
122
-
123
-
124
-
125
-
126
-
127
-
128
-
129
-
130
-
131
-
132
-
133
-
134
-
135
-
136
-
137
-
138
-
139
-
140
-
141
-
142
-
143
-
144
-
145
-
146
-
147
-
148
-
149
-
150
-
151
-
152
-
153
-
154
-
155
-
156
-
157
-
158
-
159
-
160
-
161
-
162
-
163
-
164
-
165
-
166
-
167
-
168
-
169
-
170
-
171
-
172
-
173
-
174
-
175
-
176
-
177
-
178
-
179
-
180
-
181
-
182
-
183
-
184
-
185
-
186
-
187
-
188
-
189
-
190
-
191
-
192
-
193
-
194
-
195
-
196
-
197
-
198
-
199
-
200
-
201
-
202
-
203
-
204
-
205
-
206
-
207
-
208
-
209
-
210
-
211
-
212
-
213
-
214
-
215
-
216
-
217
-
218
-
219
-
220
-
221
-
222
-
223
-
224
-
225
-
226
-
227
-
228
-
229
-
230
-
231
-
232
-
233
-
234
-
235
-
236
-
237
-
238
-
239
-
240
-
241
-
242
-
243
-
244
-
245
-
246
-
247
-
248
-
249
-
250
-
251
-
252
-
253
-
254
-
255
-
256
-
257
-
258
-
259
-
260
-
261
-
262
-
263
-
264
-
265
-
266
-
267
-
268
-
269
-
270
-
271
-
272
-
273
-
274
-
275
-
276
-
277
-
278
-
279
-
280
-
281
-
282
-
283
-
284
-
285
-
286
-
287
-
288
 |
 |

44 2015 | ANNUAL REPORT
Overview of Our Business
LATAM Dealer and Customer Financing
In the LATAM segment, we provide access to dealer and retail customer financing through both wholly-owned captive
finance companies and through strategic relationships with financial institutions.
We have two wholly-owned captive finance companies in the LATAM segment: Banco Fidis S.A. in Brazil and Fiat
Credito Compañia Financiera S.A. in Argentina. These captive finance companies offer dealer and retail customer
financing. In addition, in Brazil we have two significant commercial partnerships with Banco Itaù and Bradesco to
provide financing to retail customers purchasing Fiat brand vehicles. Banco Itaù is a leading vehicle retail financing
company in Brazil. This partnership was renewed in August 2013 for a ten-year term ending in 2023. Under this
agreement, Banco Itaù has exclusivity on our promotional campaigns and preferential rights on non-promotional
financing. We receive commissions in connection with each vehicle financing above a certain threshold. This
agreement applies only to our retail customers purchasing Fiat branded vehicles only. In July 2015, FCA Fiat Chrysler
Automoveis Brasil (“FCA Brasil”) and Banco Fidis signed a ten-year partnership contract with Bradesco, through its
affiliate Bradesco Financiamentos. Bradesco Financiamentos will finance retail sales of Jeep, Chrysler, Dodge and
Ram vehicles in Brazil. Banco Fidis will be in charge of the commercial management of this partnership, intermediating
the relationship between FCA Brasil clients and dealers with Bradesco Financiamentos regarding the offer of financial
products. Under this agreement, Bradesco has exclusivity on promotional campaigns and FCA Brasil will promote
Bradesco as official financial partner. We receive commissions for partnership and for acting as banking agent based
on profitability and penetration reached by the partnership.
APAC
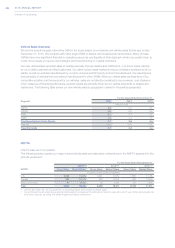
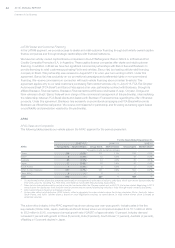
APAC Sales and Competition
The following table presents our vehicle sales in the APAC segment for the periods presented:
For the Years Ended December 31,
2015(1),(2),(4) 2014(1),(2),(4) 2013(1),(2)
APAC GroupSales MarketShare GroupSales MarketShare GroupSales MarketShare
Thousands of units (except percentages)
China 139 0.8% 171 1.0% 129 0.8%
India(3) 9 0.3% 12 0.5% 10 0.4%
Australia 35 3.1% 44 4.0% 34 3.1%
Japan 17 0.4% 18 0.4% 16 0.4%
South Korea 7 0.4% 6 0.5% 5 0.4%
APAC 5 major Markets 207 0.7% 251 0.9% 194 0.7%
Other APAC 8 — 6 — 6 —
Total 215 — 257 — 199 —
(1) Our estimated market share data presented are based on management’s estimates of industry sales data, which use certain data provided by
third-party sources, including R.L. Polk Data, and National Automobile Manufacturing Associations.
(2) Sales data include vehicles sold by certain of our joint ventures within the Chinese market and, until 2012, the Indian market. Beginning in 2013,
we took over the distribution from the joint venture partner and we started distributing vehicles in India through wholly-owned subsidiaries.
(3) India market share is based on wholesale volumes.
(4) Group sales reflect retail deliveries. APAC industry reflects aggregate for major markets where the Group competes (China, Australia, Japan,
South Korea, and India).Market share is based on retail registrations except, as noted above, in India where market share is based on
wholesale volumes.
The automotive industry in the APAC segment has shown strong year-over-year growth. Industry sales in the five
key markets (China, India, Japan, Australia and South Korea) where we compete increased from 16.1million in 2009
to 28.2million in 2015, a compound annual growth rate (“CAGR”) of approximately 10 percent. Industry demand
increased 5 percent with growth in China (8 percent), India (8 percent), South Korea (11 percent), Australia (4 percent),
offsetting a 10 percent decline in Japan.