Chrysler 2015 Annual Report Download - page 196
Download and view the complete annual report
Please find page 196 of the 2015 Chrysler annual report below. You can navigate through the pages in the report by either clicking on the pages listed below, or by using the keyword search tool below to find specific information within the annual report.-
 1
1 -
2
-
3
-
4
-
5
-
6
-
7
-
8
-
9
-
10
-
11
-
12
-
13
-
14
-
15
-
16
-
17
-
18
-
19
-
20
-
21
-
22
-
23
-
24
-
25
-
26
-
27
-
28
-
29
-
30
-
31
-
32
-
33
-
34
-
35
-
36
-
37
-
38
-
39
-
40
-
41
-
42
-
43
-
44
-
45
-
46
-
47
-
48
-
49
-
50
-
51
-
52
-
53
-
54
-
55
-
56
-
57
-
58
-
59
-
60
-
61
-
62
-
63
-
64
-
65
-
66
-
67
-
68
-
69
-
70
-
71
-
72
-
73
-
74
-
75
-
76
-
77
-
78
-
79
-
80
-
81
-
82
-
83
-
84
-
85
-
86
-
87
-
88
-
89
-
90
-
91
-
92
-
93
-
94
-
95
-
96
-
97
-
98
-
99
-
100
-
101
-
102
-
103
-
104
-
105
-
106
-
107
-
108
-
109
-
110
-
111
-
112
-
113
-
114
-
115
-
116
-
117
-
118
-
119
-
120
-
121
-
122
-
123
-
124
-
125
-
126
-
127
-
128
-
129
-
130
-
131
-
132
-
133
-
134
-
135
-
136
-
137
-
138
-
139
-
140
-
141
-
142
-
143
-
144
-
145
-
146
-
147
-
148
-
149
-
150
-
151
-
152
-
153
-
154
-
155
-
156
-
157
-
158
-
159
-
160
-
161
-
162
-
163
-
164
-
165
-
166
-
167
-
168
-
169
-
170
-
171
-
172
-
173
-
174
-
175
-
176
-
177
-
178
-
179
-
180
-
181
-
182
-
183
-
184
-
185
-
 186
186 -
 187
187 -
 188
188 -
 189
189 -
 190
190 -
 191
191 -
 192
192 -
 193
193 -
 194
194 -
 195
195 -
 196
196 -
 197
197 -
 198
198 -
 199
199 -
 200
200 -
 201
201 -
 202
202 -
 203
203 -
 204
204 -
 205
205 -
 206
206 -
207
-
208
-
209
-
210
-
211
-
212
-
213
-
214
-
215
-
216
-
217
-
218
-
219
-
220
-
221
-
222
-
223
-
224
-
225
-
226
-
227
-
228
-
229
-
230
-
231
-
232
-
233
-
234
-
235
-
236
-
237
-
238
-
239
-
240
-
241
-
242
-
243
-
244
-
245
-
246
-
247
-
248
-
249
-
250
-
251
-
252
-
253
-
254
-
255
-
256
-
257
-
258
-
259
-
260
-
261
-
262
-
263
-
264
-
265
-
266
-
267
-
268
-
269
-
270
-
271
-
272
-
273
-
274
-
275
-
276
-
277
-
278
-
279
-
280
-
281
-
282
-
283
-
284
-
285
-
286
-
287
-
288
 |
 |

196 2015 | ANNUAL REPORT
Consolidated
Financial Statements
Notes to the Consolidated
Financial Statements
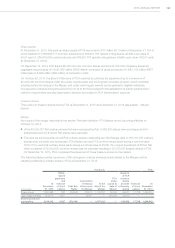
20. Share-based compensation
Performance Share Units
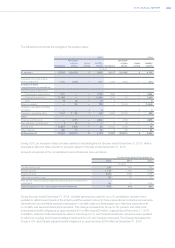
During the year ended December 31, 2015, FCA awarded a total of 14,713,100 Performance Share Units (“PSU
awards”) to certain key employees under the framework equity incentive plan (Note 19). The PSU awards, which
represent the right to receive FCA shares, have financial performance goals covering a five-year period from 2014 to
2018. The performance goals include a net income target as well as total shareholder return (“TSR”) target, with each
weighted at 50 percent and settled independently of the other. Half of the award will vest based on our achievement
of the targets for net income (“PSU NI awards”) and will have a payout scale ranging from 0 percent to 100 percent.
The remaining 50 percent of the PSU awards, (“PSU TSR awards”) are based on market conditions and have a payout
scale ranging from 0 percent to 150 percent. Accordingly, the total number of shares that will eventually be issued
may vary from the original award of 14.7 million shares. One third of total PSU awards will vest in February 2017, a
cumulative two-thirds in February 2018 and a cumulative 100 percent in February 2019 if the respective performance
goals for the years 2014 to 2016, 2014 to 2017 and 2014 to 2018 are achieved. None of the PSU awards were
forfeited and none of the outstanding PSU awards had vested as of December31, 2015.
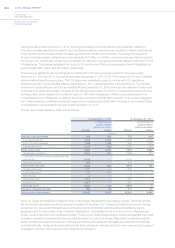
The vesting of the PSU NI awards will be determined by comparing the Group’s net profit excluding unusual
items compared to the net income targets established in the business plan that was published in May 2014. The
performance period for the PSU NI awards commenced on January 1, 2014. As the performance period commenced
substantially prior to the commencement of the service period, which coincides with the grant date, the Company
determined that the net income target did not meet the definition of a performance condition under IFRS 2 - Share-
based Payment, and therefore is required to be accounted for as a non-vesting condition. As such, the fair values
of the PSU NI awards were calculated using a Monte Carlo simulation model. The weighted average fair value of the
PSU-NI awards granted during the year ended December 31, 2015 was €8.78 (U.S.$9.76).
The key assumptions utilized to calculate the grant-date fair values for the PSU NI awards issued are summarized below:
Key assumptions Range
Grant Date Stock Price €13.44 - €15.21
Expected volatility 40%
Risk-free rate 0.7%
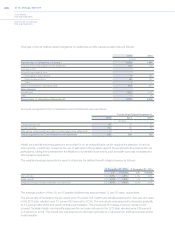
The expected volatility was based on the observed historical volatility for common shares of FCA. The risk-free rate
was based on the yields of the U.S. Treasury bonds with similar terms to the vesting date of each PSU NI award.
The weighted average fair value of the PSU TSR awards granted during the year ended December 31, 2015 was
€16.52 (U.S.$18.35), which was calculated using a Monte Carlo simulation model. The key assumptions utilized to
calculate the grant date fair values for the PSU TSR awards issued are summarized below:
Key assumptions Range
Grant Date Stock Price €13.44 - €15.21
Expected volatility 37% - 39%
Dividend yield 0%
Risk-free rate 0.7% - 0.8%
The expected volatility was based on the observed historical volatility for common shares of FCA. The risk-free rate
was based on the yields of the U.S. Treasury bonds with similar term to the vesting date of the PSU TSR awards. In
addition, since the volatility of each member of the defined peer group are not wholly independent of one another, a
correlation coefficient was developed based on historical share price changes for FCA and the defined peer group
over a three-year period leading up to the grant date of the awards.