Chrysler 2015 Annual Report Download - page 43
Download and view the complete annual report
Please find page 43 of the 2015 Chrysler annual report below. You can navigate through the pages in the report by either clicking on the pages listed below, or by using the keyword search tool below to find specific information within the annual report.-
 1
1 -
2
-
3
-
4
-
5
-
6
-
7
-
8
-
9
-
10
-
11
-
12
-
13
-
14
-
15
-
16
-
17
-
18
-
19
-
20
-
21
-
22
-
23
-
24
-
25
-
26
-
27
-
28
-
29
-
30
-
31
-
32
-
 33
33 -
 34
34 -
 35
35 -
 36
36 -
 37
37 -
 38
38 -
 39
39 -
 40
40 -
 41
41 -
 42
42 -
 43
43 -
 44
44 -
 45
45 -
 46
46 -
 47
47 -
 48
48 -
 49
49 -
 50
50 -
 51
51 -
 52
52 -
 53
53 -
54
-
55
-
56
-
57
-
58
-
59
-
60
-
61
-
62
-
63
-
64
-
65
-
66
-
67
-
68
-
69
-
70
-
71
-
72
-
73
-
74
-
75
-
76
-
77
-
78
-
79
-
80
-
81
-
82
-
83
-
84
-
85
-
86
-
87
-
88
-
89
-
90
-
91
-
92
-
93
-
94
-
95
-
96
-
97
-
98
-
99
-
100
-
101
-
102
-
103
-
104
-
105
-
106
-
107
-
108
-
109
-
110
-
111
-
112
-
113
-
114
-
115
-
116
-
117
-
118
-
119
-
120
-
121
-
122
-
123
-
124
-
125
-
126
-
127
-
128
-
129
-
130
-
131
-
132
-
133
-
134
-
135
-
136
-
137
-
138
-
139
-
140
-
141
-
142
-
143
-
144
-
145
-
146
-
147
-
148
-
149
-
150
-
151
-
152
-
153
-
154
-
155
-
156
-
157
-
158
-
159
-
160
-
161
-
162
-
163
-
164
-
165
-
166
-
167
-
168
-
169
-
170
-
171
-
172
-
173
-
174
-
175
-
176
-
177
-
178
-
179
-
180
-
181
-
182
-
183
-
184
-
185
-
186
-
187
-
188
-
189
-
190
-
191
-
192
-
193
-
194
-
195
-
196
-
197
-
198
-
199
-
200
-
201
-
202
-
203
-
204
-
205
-
206
-
207
-
208
-
209
-
210
-
211
-
212
-
213
-
214
-
215
-
216
-
217
-
218
-
219
-
220
-
221
-
222
-
223
-
224
-
225
-
226
-
227
-
228
-
229
-
230
-
231
-
232
-
233
-
234
-
235
-
236
-
237
-
238
-
239
-
240
-
241
-
242
-
243
-
244
-
245
-
246
-
247
-
248
-
249
-
250
-
251
-
252
-
253
-
254
-
255
-
256
-
257
-
258
-
259
-
260
-
261
-
262
-
263
-
264
-
265
-
266
-
267
-
268
-
269
-
270
-
271
-
272
-
273
-
274
-
275
-
276
-
277
-
278
-
279
-
280
-
281
-
282
-
283
-
284
-
285
-
286
-
287
-
288
 |
 |

2015 | ANNUAL REPORT 43
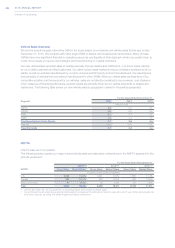
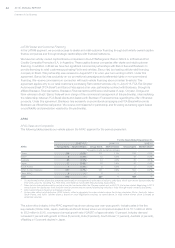
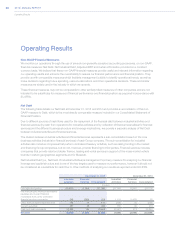
The following table presents our mass-market vehicle market share information and our principal competitors in Brazil,
our largest market in the LATAM segment:
For the Years Ended December 31,
Brazil 2015(1) 2014(1) 2013(1)
Automaker Percentage of industry
FCA 19.5% 21.2% 21.5%
GM 15.6% 17.4% 18.1%
Volkswagen(*) 15.2% 17.7% 18.8%
Ford 10.2% 9.2% 9.4%
Other 39.5% 34.5% 32.2%
Total 100.0% 100.0% 100.0%
(1) Our estimated market share data presented are based on management’s estimates of industry sales data, which use certain data provided
by third-party sources, including IHS Global Insight, National Organization of Automotive Vehicles Distribution and Association of Automotive
Producers.
(*) Including Audi.
The automotive industry within which the LATAM segment operates decreased 20.7 percent from 2014, to 4.1million
vehicles (cars and light commercial vehicles) in 2015 reflecting continued macroeconomic weakness in the region with
a decrease of 25.6 percent in Brazil and a decrease of 5 percent in Argentina.
Despite the 30 percent decrease in the Group’s sales in LATAM from 2014, the Group remained the market leader
in Brazil increasing its lead over its nearest competitor to 380 basis points with market share at 19.5 percent, which
decreased 170 basis points due to strong competition and pricing actions taken to protect margins. In Argentina,
overall market share declined from 13.4 percent to 11.9 percent mainly due to continued import restrictions.
Our vehicle sales in the LATAM segment leverage the name recognition of Fiat and the relatively urban population
of countries like Brazil to offer Fiat brand mini and small vehicles in our key markets in the LATAM segment. We are
the leading automaker in Brazil, due in large part to our market leadership in the mini and small segments (which
represent almost 58 percent of Brazilian market vehicle sales). Fiat also leads the pickup truck market in Brazil (with
the Fiat Strada, 54.1 percent of segment share), although this segment is small as a percentage of total industry and
compared to other countries in the LATAM segment. In addition, the all-new Jeep Renegade continued its growth
trend reaching 29.7 percent segment market share in Brazil in the fourth quarter of 2015 and was named the “2016
Car of the Year” in Brazil during the annual automotive industry award ceremony hosted by Autoesporte magazine
(Editora Globo).
We started production in our new assembly plant in Pernambuco, Brazil in 2015, which is enabling us to introduce
new locally-manufactured vehicles that are not subject to import restrictions.
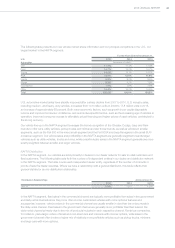
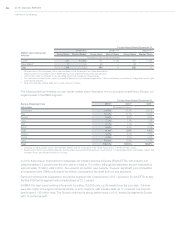
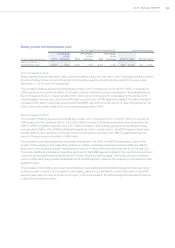
LATAM Distribution
The following table presents the number of independent entities in our dealer and distributor network. In the LATAM
segment, we generally enter into multiple dealer agreements with a single dealer, covering one or more points of sale.
Outside Brazil and Argentina, our major markets, we distribute our vehicles mainly through general distributors and
their dealer networks. This table counts each independent dealer entity, regardless of the number of contracts or
points of sale the dealer operates. Where we have relationships with a general distributor in a particular market, this
table reflects that general distributor as one distribution relationship:
Distribution Relationships At December 31,
2015 2014 2013
LATAM 442 441 450