Chrysler 2015 Annual Report Download - page 180
Download and view the complete annual report
Please find page 180 of the 2015 Chrysler annual report below. You can navigate through the pages in the report by either clicking on the pages listed below, or by using the keyword search tool below to find specific information within the annual report.-
 1
1 -
2
-
3
-
4
-
5
-
6
-
7
-
8
-
9
-
10
-
11
-
12
-
13
-
14
-
15
-
16
-
17
-
18
-
19
-
20
-
21
-
22
-
23
-
24
-
25
-
26
-
27
-
28
-
29
-
30
-
31
-
32
-
33
-
34
-
35
-
36
-
37
-
38
-
39
-
40
-
41
-
42
-
43
-
44
-
45
-
46
-
47
-
48
-
49
-
50
-
51
-
52
-
53
-
54
-
55
-
56
-
57
-
58
-
59
-
60
-
61
-
62
-
63
-
64
-
65
-
66
-
67
-
68
-
69
-
70
-
71
-
72
-
73
-
74
-
75
-
76
-
77
-
78
-
79
-
80
-
81
-
82
-
83
-
84
-
85
-
86
-
87
-
88
-
89
-
90
-
91
-
92
-
93
-
94
-
95
-
96
-
97
-
98
-
99
-
100
-
101
-
102
-
103
-
104
-
105
-
106
-
107
-
108
-
109
-
110
-
111
-
112
-
113
-
114
-
115
-
116
-
117
-
118
-
119
-
120
-
121
-
122
-
123
-
124
-
125
-
126
-
127
-
128
-
129
-
130
-
131
-
132
-
133
-
134
-
135
-
136
-
137
-
138
-
139
-
140
-
141
-
142
-
143
-
144
-
145
-
146
-
147
-
148
-
149
-
150
-
151
-
152
-
153
-
154
-
155
-
156
-
157
-
158
-
159
-
160
-
161
-
162
-
163
-
164
-
165
-
166
-
167
-
168
-
169
-
 170
170 -
 171
171 -
 172
172 -
 173
173 -
 174
174 -
 175
175 -
 176
176 -
 177
177 -
 178
178 -
 179
179 -
 180
180 -
 181
181 -
 182
182 -
 183
183 -
 184
184 -
 185
185 -
 186
186 -
 187
187 -
 188
188 -
 189
189 -
 190
190 -
191
-
192
-
193
-
194
-
195
-
196
-
197
-
198
-
199
-
200
-
201
-
202
-
203
-
204
-
205
-
206
-
207
-
208
-
209
-
210
-
211
-
212
-
213
-
214
-
215
-
216
-
217
-
218
-
219
-
220
-
221
-
222
-
223
-
224
-
225
-
226
-
227
-
228
-
229
-
230
-
231
-
232
-
233
-
234
-
235
-
236
-
237
-
238
-
239
-
240
-
241
-
242
-
243
-
244
-
245
-
246
-
247
-
248
-
249
-
250
-
251
-
252
-
253
-
254
-
255
-
256
-
257
-
258
-
259
-
260
-
261
-
262
-
263
-
264
-
265
-
266
-
267
-
268
-
269
-
270
-
271
-
272
-
273
-
274
-
275
-
276
-
277
-
278
-
279
-
280
-
281
-
282
-
283
-
284
-
285
-
286
-
287
-
288
 |
 |

180 2015 | ANNUAL REPORT
Consolidated
Financial Statements
Notes to the Consolidated
Financial Statements
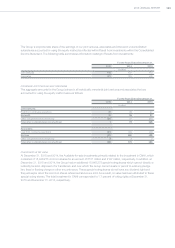
Translation differences principally reflect foreign exchange gains of €298 million in 2015 and €482 million in 2014
primarily related to foreign currency translation of the U.S.$ to the Euro.
Refer to Note 4 for information about the write-down of certain capitalized development costs.
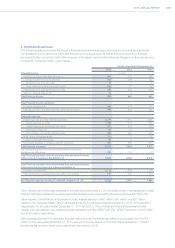
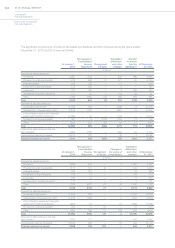
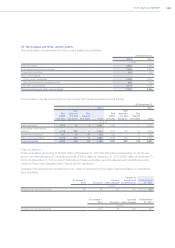
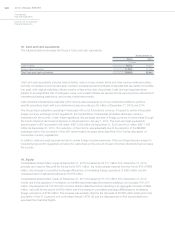
12. Property, plant and equipment
Land
Industrial
buildings
Plant,
machinery
and
equipment
Other
assets
Advances
and tangible
assets in
progress Total
(€ million)
Gross carrying amount at January1, 2014 880 7,035 38,405 2,037 2,284 50,641
Additions 14 766 2,877 292 1,466 5,415
Divestitures (7) (94) (1,248) (37) (2) (1,388)
Translation differences 35 316 1,586 168 132 2,237
Other changes 23 2 867 62 (969) (15)
Balance at December 31, 2014 945 8,025 42,487 2,522 2,911 56,890
Additions 3 534 3,262 302 2,047 6,148
Divestitures (4) (40) (1,126) (62) (6) (1,238)
Translation differences (27) (64) 231 99 (127) 112
Other changes 6 (30) 758 11 (704) 41
Transfer to Assets held for distribution (23) (317) (1,704) (138) (35) (2,217)
Balance at December 31, 2015 900 8,108 43,908 2,734 4,086 59,736
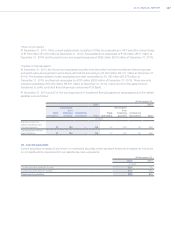
Accumulated depreciation and
impairment losses at January 1, 2014 7 2,394 23,918 1,078 11 27,408
Depreciation — 266 3,099 201 — 3,566
Divestitures (2) (87) (1,219) (33) — (1,341)
Impairment losses and asset write-offs — 6 27 — — 33
Translation differences — 57 653 61 — 771
Other changes 2 10 19 9 5 45
Balance at December 31, 2014 7 2,646 26,497 1,316 16 30,482
Depreciation — 309 3,453 262 — 4,024
Divestitures — (31) (1,091) (53) (2) (1,177)
Impairment losses and asset write-offs 1 11 474 3 1 490
Translation differences (1) (14) 3 19 (1) 6
Other changes 37 (26) 39 (2) (1) 47
Transfer to Assets held for distribution — (113) (1,375) (102) — (1,590)
Balance at December 31, 2015 44 2,782 28,000 1,443 13 32,282
Carrying amount at December 31, 2014 938 5,379 15,990 1,206 2,895 26,408
Carrying amount at December 31, 2015 856 5,326 15,908 1,291 4,073 27,454
Additions of €6,148 million in 2015 (€5,415 million in 2014) were primarily related to the mass-market vehicle
operations in the NAFTA segment, as well as for the construction of the plant in Pernambuco (Brazil).
In 2015, of the total €490 million of impairment losses and asset write-offs, €422 million related to the realignment of a
portion of the Group’s manufacturing capacity in NAFTA to better meet market demand. For the year ended December
31, 2014, €25 million of impairment losses related to the EMEA segment for certain powertrains that were abandoned.
In 2015, translation differences of €106 million mainly reflected the strengthening of the U.S.$ against the Euro, which
was partially offset by the devaluation of the Brazilian Real. In 2014, translation differences of €1,466 million mainly
reflected the strengthening of the U.S.$ against the Euro.