Chrysler 2015 Annual Report Download - page 231
Download and view the complete annual report
Please find page 231 of the 2015 Chrysler annual report below. You can navigate through the pages in the report by either clicking on the pages listed below, or by using the keyword search tool below to find specific information within the annual report.-
 1
1 -
2
-
3
-
4
-
5
-
6
-
7
-
8
-
9
-
10
-
11
-
12
-
13
-
14
-
15
-
16
-
17
-
18
-
19
-
20
-
21
-
22
-
23
-
24
-
25
-
26
-
27
-
28
-
29
-
30
-
31
-
32
-
33
-
34
-
35
-
36
-
37
-
38
-
39
-
40
-
41
-
42
-
43
-
44
-
45
-
46
-
47
-
48
-
49
-
50
-
51
-
52
-
53
-
54
-
55
-
56
-
57
-
58
-
59
-
60
-
61
-
62
-
63
-
64
-
65
-
66
-
67
-
68
-
69
-
70
-
71
-
72
-
73
-
74
-
75
-
76
-
77
-
78
-
79
-
80
-
81
-
82
-
83
-
84
-
85
-
86
-
87
-
88
-
89
-
90
-
91
-
92
-
93
-
94
-
95
-
96
-
97
-
98
-
99
-
100
-
101
-
102
-
103
-
104
-
105
-
106
-
107
-
108
-
109
-
110
-
111
-
112
-
113
-
114
-
115
-
116
-
117
-
118
-
119
-
120
-
121
-
122
-
123
-
124
-
125
-
126
-
127
-
128
-
129
-
130
-
131
-
132
-
133
-
134
-
135
-
136
-
137
-
138
-
139
-
140
-
141
-
142
-
143
-
144
-
145
-
146
-
147
-
148
-
149
-
150
-
151
-
152
-
153
-
154
-
155
-
156
-
157
-
158
-
159
-
160
-
161
-
162
-
163
-
164
-
165
-
166
-
167
-
168
-
169
-
170
-
171
-
172
-
173
-
174
-
175
-
176
-
177
-
178
-
179
-
180
-
181
-
182
-
183
-
184
-
185
-
186
-
187
-
188
-
189
-
190
-
191
-
192
-
193
-
194
-
195
-
196
-
197
-
198
-
199
-
200
-
201
-
202
-
203
-
204
-
205
-
206
-
207
-
208
-
209
-
210
-
211
-
212
-
213
-
214
-
215
-
216
-
217
-
218
-
219
-
220
-
 221
221 -
 222
222 -
 223
223 -
 224
224 -
 225
225 -
 226
226 -
 227
227 -
 228
228 -
 229
229 -
 230
230 -
 231
231 -
 232
232 -
 233
233 -
 234
234 -
 235
235 -
 236
236 -
 237
237 -
 238
238 -
 239
239 -
 240
240 -
 241
241 -
242
-
243
-
244
-
245
-
246
-
247
-
248
-
249
-
250
-
251
-
252
-
253
-
254
-
255
-
256
-
257
-
258
-
259
-
260
-
261
-
262
-
263
-
264
-
265
-
266
-
267
-
268
-
269
-
270
-
271
-
272
-
273
-
274
-
275
-
276
-
277
-
278
-
279
-
280
-
281
-
282
-
283
-
284
-
285
-
286
-
287
-
288
 |
 |

2015 | ANNUAL REPORT 231
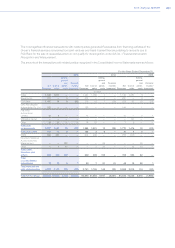
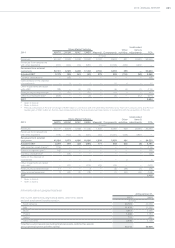
Mass-Market Vehicles
Maserati Components
Other
activities
Unallocated
items &
adjustments FCA
2014 NAFTA LATAM APAC EMEA
(€ million)
Revenues 52,452 8,629 6,259 18,020 2,767 8,619 831 (3,937) 93,640
Revenues from transactions
with other segments (271) (100) (10) (587) (7) (2,526) (436) 3,937 —
Revenues from external
customers 52,181 8,529 6,249 17,433 2,760 6,093 395 — 93,640
Adjusted EBIT 2,179 289 541 (41) 275 285 (116) (50) 3,362
Currency devaluations(1) — (98) — — — — — — (98)
Gains/(losses) on the disposal
of investments — 8 — 1 — (1) 4 — 12
Other impairments and asset
write offs(2) (28) — (4) (72) — (5) (5) (1) (115)
Restructuring (costs)/reversal 5 (22) — (21) — (15) 3 — (50)
Other income/(expenses)(3) (509) — — 24 — (4) — 212 (277)
EBIT 2,834
(1) Refer to Note 2;
(2) Refer to Note 4;
(3) Primarily comprised of the one-off charge of €495 million in connection with the UAW MOU entered into by FCA US in January 2014 and the non-
taxable gain of €223 million on the fair value remeasurement of the previously exercised options in connection with the acquisition of FCA US
Mass-Market Vehicles
Maserati Components
Other
activities
Unallocated
items &
adjustments FCA
2013 NAFTA LATAM APAC EMEA
(€ million)
Revenues 45,777 9,973 4,668 17,335 1,659 8,080 929 (3,891) 84,530
Revenues from transactions
with other segments (173) (100) (2) (637) (20) (2,521) (438) 3,891 —
Revenues from external
customers 45,604 9,873 4,666 16,698 1,639 5,559 491 — 84,530
Adjusted EBIT 2,219 619 338 (291) 171 208 (80) (3) 3,181
Jeep voluntary recall charge(1) (115) — — — — — — — (115)
Pension curtailment gain(1) 166 — — — — — — — 166
Currency devaluations(1) — (43) — — — — — — (43)
Gains on the disposal of
investments — — — 6 — — 2 — 8
Other impairments and asset
write offs(2) — (32) — (206) (65) (59) — — (362)
Restructuring (costs)/reversal 11 — — 3 — (2) (39) (1) (28)
Other income/(expenses) 9 (52) (3) (18) — (1) (50) (54) (169)
EBIT 2,638
(1) Refer to Note 2;
(2) Refer to Note 4
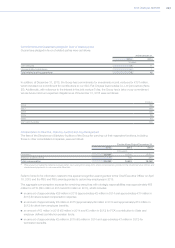
Information about geographical area
At December 31,
Non-current assets (excluding financial assets, deferred tax assets
and post-employment benefits assets) in:
2015 2014
(€ million)
North America 33,701 30,539
Italy 11,476 11,538
Brazil 4,612 4,638
Poland 1,208 1,183
Serbia 772 882
Other countries 2,346 2,129
Total Non-current assets (excluding financial assets, deferred tax assets
and post-employment benefits assets) 54,115 50,909