Chrysler 2015 Annual Report Download - page 206
Download and view the complete annual report
Please find page 206 of the 2015 Chrysler annual report below. You can navigate through the pages in the report by either clicking on the pages listed below, or by using the keyword search tool below to find specific information within the annual report.-
 1
1 -
2
-
3
-
4
-
5
-
6
-
7
-
8
-
9
-
10
-
11
-
12
-
13
-
14
-
15
-
16
-
17
-
18
-
19
-
20
-
21
-
22
-
23
-
24
-
25
-
26
-
27
-
28
-
29
-
30
-
31
-
32
-
33
-
34
-
35
-
36
-
37
-
38
-
39
-
40
-
41
-
42
-
43
-
44
-
45
-
46
-
47
-
48
-
49
-
50
-
51
-
52
-
53
-
54
-
55
-
56
-
57
-
58
-
59
-
60
-
61
-
62
-
63
-
64
-
65
-
66
-
67
-
68
-
69
-
70
-
71
-
72
-
73
-
74
-
75
-
76
-
77
-
78
-
79
-
80
-
81
-
82
-
83
-
84
-
85
-
86
-
87
-
88
-
89
-
90
-
91
-
92
-
93
-
94
-
95
-
96
-
97
-
98
-
99
-
100
-
101
-
102
-
103
-
104
-
105
-
106
-
107
-
108
-
109
-
110
-
111
-
112
-
113
-
114
-
115
-
116
-
117
-
118
-
119
-
120
-
121
-
122
-
123
-
124
-
125
-
126
-
127
-
128
-
129
-
130
-
131
-
132
-
133
-
134
-
135
-
136
-
137
-
138
-
139
-
140
-
141
-
142
-
143
-
144
-
145
-
146
-
147
-
148
-
149
-
150
-
151
-
152
-
153
-
154
-
155
-
156
-
157
-
158
-
159
-
160
-
161
-
162
-
163
-
164
-
165
-
166
-
167
-
168
-
169
-
170
-
171
-
172
-
173
-
174
-
175
-
176
-
177
-
178
-
179
-
180
-
181
-
182
-
183
-
184
-
185
-
186
-
187
-
188
-
189
-
190
-
191
-
192
-
193
-
194
-
195
-
 196
196 -
 197
197 -
 198
198 -
 199
199 -
 200
200 -
 201
201 -
 202
202 -
 203
203 -
 204
204 -
 205
205 -
 206
206 -
 207
207 -
 208
208 -
 209
209 -
 210
210 -
 211
211 -
 212
212 -
 213
213 -
 214
214 -
 215
215 -
 216
216 -
217
-
218
-
219
-
220
-
221
-
222
-
223
-
224
-
225
-
226
-
227
-
228
-
229
-
230
-
231
-
232
-
233
-
234
-
235
-
236
-
237
-
238
-
239
-
240
-
241
-
242
-
243
-
244
-
245
-
246
-
247
-
248
-
249
-
250
-
251
-
252
-
253
-
254
-
255
-
256
-
257
-
258
-
259
-
260
-
261
-
262
-
263
-
264
-
265
-
266
-
267
-
268
-
269
-
270
-
271
-
272
-
273
-
274
-
275
-
276
-
277
-
278
-
279
-
280
-
281
-
282
-
283
-
284
-
285
-
286
-
287
-
288
 |
 |

206 2015 | ANNUAL REPORT
Consolidated
Financial Statements
Notes to the Consolidated
Financial Statements
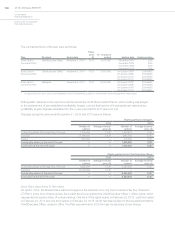
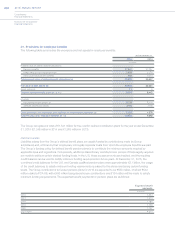
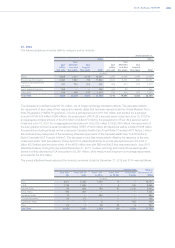
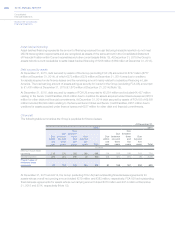
Changes in the net defined benefit obligations for healthcare and life insurance plans were as follows:
2015 2014
(€ million)
Present value of obligations at January1, 2,276 1,945
Included in the Consolidated Income Statement 134 126
Included in OCI:
Actuarial losses/(gains) from:
- Demographic assumptions 5(95)
- Financial assumptions (9) 187
- Other 1—
Effect of movements in exchange rates 204 244
Other changes
Benefits paid (152) (128)
Other —(3)
Present value of obligations at December 31, 2,459 2,276
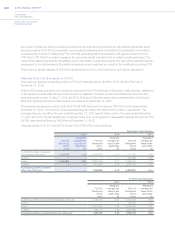
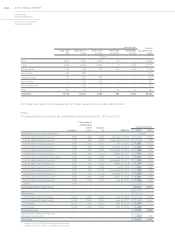
Amounts recognized in the Consolidated Income Statement were as follows:
For the Years Ended December 31,
2015 2014 2013
(€ million)
Current service cost 32 21 23
Interest expense 102 98 89
Past service costs (credits) and gains or losses arising from settlements —7 —
Total recognized in the Consolidated Income Statement 134 126 112
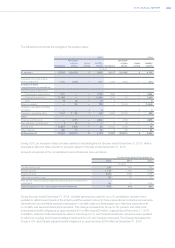
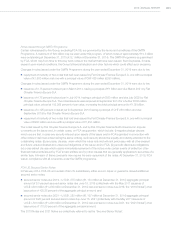
Health care and life insurance plans are accounted for on an actuarial basis, which requires the selection of various
assumptions, in particular, it requires the use of estimates of the present value of the projected future payments to all
participants, taking into consideration the likelihood of potential future events such as health care cost increases and
demographic experience.
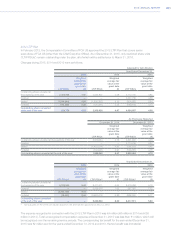
The weighted average assumptions used to determine the defined benefit obligations were as follows:
At December 31, 2015 At December 31, 2014
U.S. Canada U.S. Canada
Discount rate 4.5% 4.2% 4.1% 3.9%
Salary growth 1.5% 1.5% —% —%
Weighted average ultimate healthcare cost trend rate 4.5% 4.3% 5.0% 3.6%
The average duration of the U.S. and Canadian liabilities was approximately 13 and 16 years, respectively.
The annual rate of increase in the per capita cost of covered U.S. health care benefits assumed for next year and used
in the 2015 plan valuation was 7.0 percent (6.5 percent in 2014). The annual rate was assumed to decrease gradually
to 4.5 percent after 2029 and remain at that level thereafter. The annual rate of increase in the per capita cost of
covered Canadian health care benefits assumed for next year and used in the 2015 plan valuation was 4.66 percent
(3.3 percent in 2014). The annual rate was assumed to decrease gradually to 4.32 percent in 2029 and remain at that
level thereafter.