Chrysler 2015 Annual Report Download - page 230
Download and view the complete annual report
Please find page 230 of the 2015 Chrysler annual report below. You can navigate through the pages in the report by either clicking on the pages listed below, or by using the keyword search tool below to find specific information within the annual report.-
 1
1 -
2
-
3
-
4
-
5
-
6
-
7
-
8
-
9
-
10
-
11
-
12
-
13
-
14
-
15
-
16
-
17
-
18
-
19
-
20
-
21
-
22
-
23
-
24
-
25
-
26
-
27
-
28
-
29
-
30
-
31
-
32
-
33
-
34
-
35
-
36
-
37
-
38
-
39
-
40
-
41
-
42
-
43
-
44
-
45
-
46
-
47
-
48
-
49
-
50
-
51
-
52
-
53
-
54
-
55
-
56
-
57
-
58
-
59
-
60
-
61
-
62
-
63
-
64
-
65
-
66
-
67
-
68
-
69
-
70
-
71
-
72
-
73
-
74
-
75
-
76
-
77
-
78
-
79
-
80
-
81
-
82
-
83
-
84
-
85
-
86
-
87
-
88
-
89
-
90
-
91
-
92
-
93
-
94
-
95
-
96
-
97
-
98
-
99
-
100
-
101
-
102
-
103
-
104
-
105
-
106
-
107
-
108
-
109
-
110
-
111
-
112
-
113
-
114
-
115
-
116
-
117
-
118
-
119
-
120
-
121
-
122
-
123
-
124
-
125
-
126
-
127
-
128
-
129
-
130
-
131
-
132
-
133
-
134
-
135
-
136
-
137
-
138
-
139
-
140
-
141
-
142
-
143
-
144
-
145
-
146
-
147
-
148
-
149
-
150
-
151
-
152
-
153
-
154
-
155
-
156
-
157
-
158
-
159
-
160
-
161
-
162
-
163
-
164
-
165
-
166
-
167
-
168
-
169
-
170
-
171
-
172
-
173
-
174
-
175
-
176
-
177
-
178
-
179
-
180
-
181
-
182
-
183
-
184
-
185
-
186
-
187
-
188
-
189
-
190
-
191
-
192
-
193
-
194
-
195
-
196
-
197
-
198
-
199
-
200
-
201
-
202
-
203
-
204
-
205
-
206
-
207
-
208
-
209
-
210
-
211
-
212
-
213
-
214
-
215
-
216
-
217
-
218
-
219
-
 220
220 -
 221
221 -
 222
222 -
 223
223 -
 224
224 -
 225
225 -
 226
226 -
 227
227 -
 228
228 -
 229
229 -
 230
230 -
 231
231 -
 232
232 -
 233
233 -
 234
234 -
 235
235 -
 236
236 -
 237
237 -
 238
238 -
 239
239 -
 240
240 -
241
-
242
-
243
-
244
-
245
-
246
-
247
-
248
-
249
-
250
-
251
-
252
-
253
-
254
-
255
-
256
-
257
-
258
-
259
-
260
-
261
-
262
-
263
-
264
-
265
-
266
-
267
-
268
-
269
-
270
-
271
-
272
-
273
-
274
-
275
-
276
-
277
-
278
-
279
-
280
-
281
-
282
-
283
-
284
-
285
-
286
-
287
-
288
 |
 |

230 2015 | ANNUAL REPORT
Consolidated
Financial Statements
Notes to the Consolidated
Financial Statements
29. Segment reporting
The reportable segments, as described in the section —Segment reporting above, reflect the operating segments of the
Group that are regularly reviewed by the Chief Executive Officer, who is the “chief operating decision maker”, for making
strategic decisions, allocating resources and assessing performance, and that exceed the quantitative threshold provided
in IFRS 8 - Operating Segments, or whose information is considered useful for the users of the financial statements.
Transactions among mass-market vehicle segments generally are presented on a “where-sold” basis, which reflects
the profit/(loss) on the ultimate sale to the external customer within the segment. This presentation generally eliminates
the effect of the legal entity transfer price within the segments. Revenues of the other segments, aside from the mass-
market vehicle segments, are those directly generated by or attributable to the segment as the result of its usual
business activities and include revenues from transactions with third parties as well as those arising from transactions
with segments, recognized at normal market prices.
Other activities include the results of the activities and businesses that are not operating segments under IFRS 8 - Operating
Segments. In addition, Unallocated items and adjustments include consolidation adjustments and eliminations in addition
to financial income and expense and income taxes that are not attributable to the performance of the segments as they do
not fall under the scope of their operational responsibilities. As a result, such items and adjustments, which primarily arise
from the management of treasury assets and liabilities by the treasuries of FCA and FCA US that work independently and
separately within the Group, are subject to separate assessment by the chief operating decision maker.
Adjusted Earnings Before Interest and Taxes (“Adjusted EBIT”) is the measure used by the chief operating decision
maker to assess performance, allocate resources to the Group’s operating segments and to view operating trends,
perform analytical comparisons and benchmark performance between periods and among the segments. Adjusted EBIT
is calculated as EBIT excluding: gains/(losses) on the disposal of investments, restructuring, impairments, asset write-offs
and other unusual income/(expenses) that are considered rare or discrete events that are infrequent in nature. See below
for a reconciliation of Adjusted EBIT to EBIT, which is the most directly comparable measure included in our Consolidated
Income Statement. Operating assets are not included in the data reviewed by the chief operating decision maker, and as
a result and as permitted by IFRS 8 - Operating Segments, the related information is not provided.
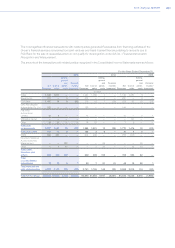
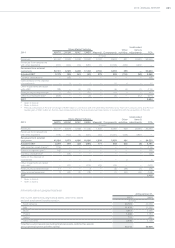
The following tables summarize selected financial information by segment for the years ended December 31, 2015,
2014 and 2013:
Mass-Market Vehicles
Maserati Components
Other
activities
Unallocated
items &
adjustments FCA2015 NAFTA LATAM APAC EMEA
(€ million)
Revenues 69,992 6,431 4,885 20,350 2,411 9,770 844 (4,088) 110,595
Revenues from transactions
with other segments (1) (194) (25) (304) (13) (3,095) (456) 4,088 —
Revenues from external
customers 69,991 6,237 4,860 20,046 2,398 6,675 388 — 110,595
Adjusted EBIT 4,450 (87) 52 213 105 395 (150) (184) 4,794
Change in estimate for future
recall campaign costs(1) (761) — — — — — — — (761)
Tianjin (China) port explosions(2) — — (142) — — — — — (142)
NAFTA capacity realignment(3) (834) — — — — — — — (834)
Currency devaluations(1) — (163) — — — — — — (163)
NHTSA Consent Order and
Amendment(4) (144) — — — — — — — (144)
Other impairments and asset
write offs — (16) (22) (46) (3) (20) — (11) (118)
Restructuring (costs)/reversal 11 (40) — — — (23) (2) 1 (53)
Other income/(expenses) 97 — (41) (1) — (8) 1 (2) 46
EBIT 2,625
(1) Refer to Note 2;
(2) Adjustment relates to the write-down of inventory (€53 million) and incremental incentives (€89 million) for vehicles affected by the explosions
at the Port of Tianjin in August 2015;
(3) Refer to Notes 2 and 4;
(4) Refer to Note 5