Chrysler 2015 Annual Report Download - page 188
Download and view the complete annual report
Please find page 188 of the 2015 Chrysler annual report below. You can navigate through the pages in the report by either clicking on the pages listed below, or by using the keyword search tool below to find specific information within the annual report.-
 1
1 -
2
-
3
-
4
-
5
-
6
-
7
-
8
-
9
-
10
-
11
-
12
-
13
-
14
-
15
-
16
-
17
-
18
-
19
-
20
-
21
-
22
-
23
-
24
-
25
-
26
-
27
-
28
-
29
-
30
-
31
-
32
-
33
-
34
-
35
-
36
-
37
-
38
-
39
-
40
-
41
-
42
-
43
-
44
-
45
-
46
-
47
-
48
-
49
-
50
-
51
-
52
-
53
-
54
-
55
-
56
-
57
-
58
-
59
-
60
-
61
-
62
-
63
-
64
-
65
-
66
-
67
-
68
-
69
-
70
-
71
-
72
-
73
-
74
-
75
-
76
-
77
-
78
-
79
-
80
-
81
-
82
-
83
-
84
-
85
-
86
-
87
-
88
-
89
-
90
-
91
-
92
-
93
-
94
-
95
-
96
-
97
-
98
-
99
-
100
-
101
-
102
-
103
-
104
-
105
-
106
-
107
-
108
-
109
-
110
-
111
-
112
-
113
-
114
-
115
-
116
-
117
-
118
-
119
-
120
-
121
-
122
-
123
-
124
-
125
-
126
-
127
-
128
-
129
-
130
-
131
-
132
-
133
-
134
-
135
-
136
-
137
-
138
-
139
-
140
-
141
-
142
-
143
-
144
-
145
-
146
-
147
-
148
-
149
-
150
-
151
-
152
-
153
-
154
-
155
-
156
-
157
-
158
-
159
-
160
-
161
-
162
-
163
-
164
-
165
-
166
-
167
-
168
-
169
-
170
-
171
-
172
-
173
-
174
-
175
-
176
-
177
-
 178
178 -
 179
179 -
 180
180 -
 181
181 -
 182
182 -
 183
183 -
 184
184 -
 185
185 -
 186
186 -
 187
187 -
 188
188 -
 189
189 -
 190
190 -
 191
191 -
 192
192 -
 193
193 -
 194
194 -
 195
195 -
 196
196 -
 197
197 -
 198
198 -
199
-
200
-
201
-
202
-
203
-
204
-
205
-
206
-
207
-
208
-
209
-
210
-
211
-
212
-
213
-
214
-
215
-
216
-
217
-
218
-
219
-
220
-
221
-
222
-
223
-
224
-
225
-
226
-
227
-
228
-
229
-
230
-
231
-
232
-
233
-
234
-
235
-
236
-
237
-
238
-
239
-
240
-
241
-
242
-
243
-
244
-
245
-
246
-
247
-
248
-
249
-
250
-
251
-
252
-
253
-
254
-
255
-
256
-
257
-
258
-
259
-
260
-
261
-
262
-
263
-
264
-
265
-
266
-
267
-
268
-
269
-
270
-
271
-
272
-
273
-
274
-
275
-
276
-
277
-
278
-
279
-
280
-
281
-
282
-
283
-
284
-
285
-
286
-
287
-
288
 |
 |

188 2015 | ANNUAL REPORT
Consolidated
Financial Statements
Notes to the Consolidated
Financial Statements
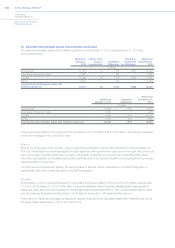
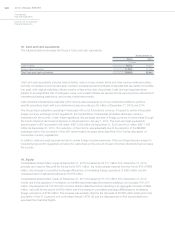
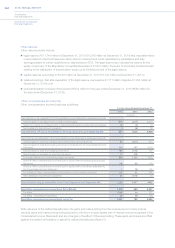
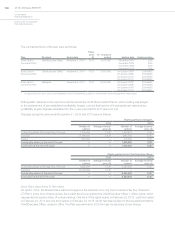
17. Other financial assets and Other financial liabilities
These line items mainly consist of fair value measurement of derivative financial instruments. They also include some
collateral deposits (held in connection with derivative transactions and debt obligations).
At December 31,
2015 2014
Positivefair
value
Negativefair
value
Positivefair
value
Negativefair
value
(€ million)
Fair value hedges:
Interest rate risk - interest rate swaps 58 (3) 82 —
Interest rate and exchange rate risk - combined interest rate
and currency swaps — (96) — (41)
Total Fair value hedges 58 (99) 82 (41)
Cash flow hedges:
Currency risks - forward contracts, currency swaps and
currency options 287 (376) 222 (467)
Interest rate risk - interest rate swaps 1 — 1 (4)
Interest rate and currency risk - combined interest rate and
currency swaps 127 (1) 60 (7)
Commodity price risk – commodity swaps and commodity options — (43) 4 (16)
Total Cash flow hedges 415 (420) 287 (494)
Derivatives for trading 340 (217) 108 (213)
Fair value of derivative instruments 813 (736) 477 (748)
Collateral deposits 40 — 38 —
Other financial assets/(liabilities) 853 (736) 515 (748)
The overall change in Other financial assets (from €515 million at December31, 2014 to €853 million at December31,
2015) and in Other financial liabilities (from €748 million at December31, 2014 to €736 million at December31, 2015)
was mostly due to fluctuations in exchange rates, interest rates, commodity prices during the year and the settlement
of the instruments which matured during the year ended December 31, 2015.
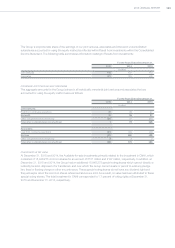
As Other financial assets and liabilities primarily consist of hedging derivatives, the change in their value is
compensated by the change in the value of the hedged items.
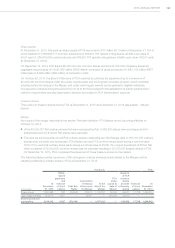
At December31, 2015 and 2014, Derivatives for trading primarily consisted of derivative contracts entered for hedging
purposes which do not qualify for hedge accounting and one embedded derivative in a bond issue in which the yield is
determined as a function of trends in the inflation rate and related hedging derivative, which converts the exposure to
floating rate (the total value of the embedded derivative is offset by the value of the hedging derivative).
The following table summarizes the outstanding notional amounts of the Group’s derivative financial instruments by
due date:
At December 31,
2015 2014
Due
within
one year
Due
between
oneand
five years
Due
beyond
five
years Total
Due
within
one year
Due
between
oneand
five years
Due
beyond
five
years Total
(€ million)
Currency risk management 18,769 363 — 19,132 15,328 2,544 — 17,872
Interest rate risk management 264 1,448 — 1,712 172 1,656 — 1,828
Interest rate and currency risk management 1,380 1,178 65 2,623 698 1,513 — 2,211
Commodity price risk management 517 31 — 548 483 59 — 542
Other derivative financial instruments — — 14 14 — — 14 14
Total notional amount 20,930 3,020 79 24,029 16,681 5,772 14 22,467