Chrysler 2015 Annual Report Download - page 61
Download and view the complete annual report
Please find page 61 of the 2015 Chrysler annual report below. You can navigate through the pages in the report by either clicking on the pages listed below, or by using the keyword search tool below to find specific information within the annual report.-
 1
1 -
2
-
3
-
4
-
5
-
6
-
7
-
8
-
9
-
10
-
11
-
12
-
13
-
14
-
15
-
16
-
17
-
18
-
19
-
20
-
21
-
22
-
23
-
24
-
25
-
26
-
27
-
28
-
29
-
30
-
31
-
32
-
33
-
34
-
35
-
36
-
37
-
38
-
39
-
40
-
41
-
42
-
43
-
44
-
45
-
46
-
47
-
48
-
49
-
50
-
 51
51 -
 52
52 -
 53
53 -
 54
54 -
 55
55 -
 56
56 -
 57
57 -
 58
58 -
 59
59 -
 60
60 -
 61
61 -
 62
62 -
 63
63 -
 64
64 -
 65
65 -
 66
66 -
 67
67 -
 68
68 -
 69
69 -
 70
70 -
 71
71 -
72
-
73
-
74
-
75
-
76
-
77
-
78
-
79
-
80
-
81
-
82
-
83
-
84
-
85
-
86
-
87
-
88
-
89
-
90
-
91
-
92
-
93
-
94
-
95
-
96
-
97
-
98
-
99
-
100
-
101
-
102
-
103
-
104
-
105
-
106
-
107
-
108
-
109
-
110
-
111
-
112
-
113
-
114
-
115
-
116
-
117
-
118
-
119
-
120
-
121
-
122
-
123
-
124
-
125
-
126
-
127
-
128
-
129
-
130
-
131
-
132
-
133
-
134
-
135
-
136
-
137
-
138
-
139
-
140
-
141
-
142
-
143
-
144
-
145
-
146
-
147
-
148
-
149
-
150
-
151
-
152
-
153
-
154
-
155
-
156
-
157
-
158
-
159
-
160
-
161
-
162
-
163
-
164
-
165
-
166
-
167
-
168
-
169
-
170
-
171
-
172
-
173
-
174
-
175
-
176
-
177
-
178
-
179
-
180
-
181
-
182
-
183
-
184
-
185
-
186
-
187
-
188
-
189
-
190
-
191
-
192
-
193
-
194
-
195
-
196
-
197
-
198
-
199
-
200
-
201
-
202
-
203
-
204
-
205
-
206
-
207
-
208
-
209
-
210
-
211
-
212
-
213
-
214
-
215
-
216
-
217
-
218
-
219
-
220
-
221
-
222
-
223
-
224
-
225
-
226
-
227
-
228
-
229
-
230
-
231
-
232
-
233
-
234
-
235
-
236
-
237
-
238
-
239
-
240
-
241
-
242
-
243
-
244
-
245
-
246
-
247
-
248
-
249
-
250
-
251
-
252
-
253
-
254
-
255
-
256
-
257
-
258
-
259
-
260
-
261
-
262
-
263
-
264
-
265
-
266
-
267
-
268
-
269
-
270
-
271
-
272
-
273
-
274
-
275
-
276
-
277
-
278
-
279
-
280
-
281
-
282
-
283
-
284
-
285
-
286
-
287
-
288
 |
 |

2015 | ANNUAL REPORT 61
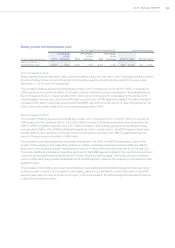
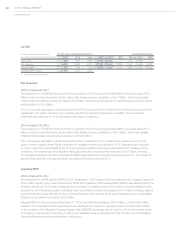
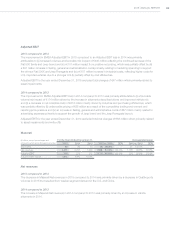
2014 compared to 2013
The decrease in LATAM Adjusted EBIT in 2014 compared to 2013 was primarily attributable to (i) an unfavorable
volume/mix impact of €228 million related to a decrease in shipments, partially offset by an improvement in vehicle
mix in Brazil, (ii) an increase in industrial costs of €441 million largely attributable to price increases for certain foreign
currency denominated purchases, which were impacted by the weakening of the Brazilian Real and (iii) the impact of
unfavorable foreign currency translation of €51 million attributable to the weakening of the Brazilian Real against the
Euro, which was partially offset by (v) favorable pricing of €381 million driven by pricing actions in Brazil and Argentina.
LATAM Adjusted EBIT for the year ended December 31, 2014 excluded €98 million for the re-measurement charge
on the Venezuelan subsidiary’s net monetary assets from VEF into U.S.$ (refer to Note 30 within our Consolidated
Financial Statements included elsewhere in this report).
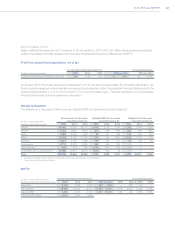
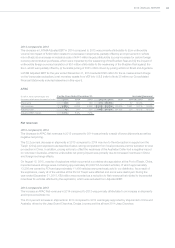
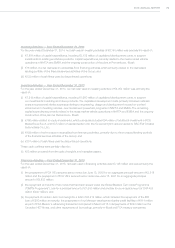
APAC
(€ million, except percentages and
shipments which are in thousands of units)
For the Years Ended December 31, Increase/(decrease)
2015 2014 2013 2015 vs. 2014 CER 2014 vs. 2013 CER
Shipments 149 220 163 (71) (32.3)% — 57 35.0% —
Net revenues 4,885 6,259 4,668 (1,374) (22.0)% (30.8)% 1,591 34.1% 34.6%
Adjusted EBIT 52 541 338 (489) (90.4)% (94.8)% 203 60.1% 60.1%
Adjusted EBIT margin 1.1% 8.6% 7.2%
Net revenues
2015 compared to 2014
The decrease in APAC Net revenues in 2015 compared to 2014 was primarily a result of lower shipments as well as
negative net pricing.
The 32.3 percent decrease in shipments in 2015 compared to 2014 was due to the interruption in supply from the
Tianjin (China) port explosions as described below, strong competition from local producers and the transition to local
production in China. In addition, pricing actions to offset the weakness of the Australian Dollar had a negative impact
on volumes in Australia, while the unfavorable net pricing impact was primarily due to increased incentives in China
and foreign exchange effects.
On August 12, 2015, a series of explosions which occurred at a container storage station at the Port of Tianjin, China,
impacted several storage areas containing approximately 25,000 FCA branded vehicles, of which approximately
13,300 are owned by FCA and approximately 11,400 vehicles were previously sold to our distributor. As a result of
the explosions, nearly all of the vehicles at the Port of Tianjin were affected and some were destroyed. During the
year ended December 31, 2015, €89 million was recorded as a reduction to Net revenues that related to incremental
incentives for vehicles affected by the explosions, which was excluded from Adjusted EBIT.
2014 compared to 2013
The increase in APAC Net revenues in 2014 compared to 2013 was primarily attributable to an increase in shipments
and improved vehicle mix.
The 35.0 percent increase in shipments in 2014 compared to 2013 was largely supported by shipments to China and
Australia, driven by the Jeep Grand Cherokee, Dodge Journey and the all-new 2014 Jeep Cherokee.