Chrysler 2015 Annual Report Download - page 147
Download and view the complete annual report
Please find page 147 of the 2015 Chrysler annual report below. You can navigate through the pages in the report by either clicking on the pages listed below, or by using the keyword search tool below to find specific information within the annual report.-
 1
1 -
2
-
3
-
4
-
5
-
6
-
7
-
8
-
9
-
10
-
11
-
12
-
13
-
14
-
15
-
16
-
17
-
18
-
19
-
20
-
21
-
22
-
23
-
24
-
25
-
26
-
27
-
28
-
29
-
30
-
31
-
32
-
33
-
34
-
35
-
36
-
37
-
38
-
39
-
40
-
41
-
42
-
43
-
44
-
45
-
46
-
47
-
48
-
49
-
50
-
51
-
52
-
53
-
54
-
55
-
56
-
57
-
58
-
59
-
60
-
61
-
62
-
63
-
64
-
65
-
66
-
67
-
68
-
69
-
70
-
71
-
72
-
73
-
74
-
75
-
76
-
77
-
78
-
79
-
80
-
81
-
82
-
83
-
84
-
85
-
86
-
87
-
88
-
89
-
90
-
91
-
92
-
93
-
94
-
95
-
96
-
97
-
98
-
99
-
100
-
101
-
102
-
103
-
104
-
105
-
106
-
107
-
108
-
109
-
110
-
111
-
112
-
113
-
114
-
115
-
116
-
117
-
118
-
119
-
120
-
121
-
122
-
123
-
124
-
125
-
126
-
127
-
128
-
129
-
130
-
131
-
132
-
133
-
134
-
135
-
136
-
 137
137 -
 138
138 -
 139
139 -
 140
140 -
 141
141 -
 142
142 -
 143
143 -
 144
144 -
 145
145 -
 146
146 -
 147
147 -
 148
148 -
 149
149 -
 150
150 -
 151
151 -
 152
152 -
 153
153 -
 154
154 -
 155
155 -
 156
156 -
 157
157 -
158
-
159
-
160
-
161
-
162
-
163
-
164
-
165
-
166
-
167
-
168
-
169
-
170
-
171
-
172
-
173
-
174
-
175
-
176
-
177
-
178
-
179
-
180
-
181
-
182
-
183
-
184
-
185
-
186
-
187
-
188
-
189
-
190
-
191
-
192
-
193
-
194
-
195
-
196
-
197
-
198
-
199
-
200
-
201
-
202
-
203
-
204
-
205
-
206
-
207
-
208
-
209
-
210
-
211
-
212
-
213
-
214
-
215
-
216
-
217
-
218
-
219
-
220
-
221
-
222
-
223
-
224
-
225
-
226
-
227
-
228
-
229
-
230
-
231
-
232
-
233
-
234
-
235
-
236
-
237
-
238
-
239
-
240
-
241
-
242
-
243
-
244
-
245
-
246
-
247
-
248
-
249
-
250
-
251
-
252
-
253
-
254
-
255
-
256
-
257
-
258
-
259
-
260
-
261
-
262
-
263
-
264
-
265
-
266
-
267
-
268
-
269
-
270
-
271
-
272
-
273
-
274
-
275
-
276
-
277
-
278
-
279
-
280
-
281
-
282
-
283
-
284
-
285
-
286
-
287
-
288
 |
 |

2015 | ANNUAL REPORT 147
Assets held under finance leases, which provide the Group with substantially all the risks and rewards of ownership, are
recognized as assets of the Group at their fair value or, if lower, at the present value of the minimum lease payments. The
corresponding liability to the lessor is included in the Consolidated Statement of Financial Position within Debt.
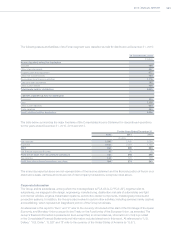
During years ended December31, 2015, 2014 and 2013, the assets were depreciated on a straight-line basis over
their estimated useful lives using the following rates:
Depreciationrates
Buildings 3%-8%
Plant, machinery and equipment 3%-33%
Other assets 5%-33%
Leases under which the lessor retains substantially all the risks and rewards of ownership of the leased assets are
classified as operating leases. Operating lease expenditures are expensed on a straight-line basis over the lease terms.
Borrowing costs
Borrowing costs that are directly attributable to the acquisition, construction or production of property, plant or
equipment or an intangible asset that is deemed to be a qualifying asset as defined in IAS 23 - Borrowing Costs are
capitalized. The amount of borrowing costs eligible for capitalization corresponds to the actual borrowing costs incurred
during the period less any investment income on the temporary investment of any borrowed funds not yet used. The
amount of borrowing costs capitalized at December31, 2015 and 2014 was €286 million and €256 million, respectively.
Impairment of assets
At the end of each reporting period, the Group assesses whether there is any indication that its intangible assets
(including capitalized development costs) and its property, plant and equipment may be impaired.
If indications of impairment are present, the carrying amount of the asset is reduced to its recoverable amount which
is the higher of fair value less costs to sell and its value in use. The recoverable amount is determined for the individual
asset, unless the asset does not generate cash inflows that are largely independent of those from other assets or
groups of assets, in which case the asset is tested as part of the cash-generating unit (“CGU”) to which the asset
belongs. A CGU is the smallest identifiable group of assets that generates cash inflows that are largely independent
of the cash inflows from other assets or groups of assets. In assessing the value in use of an asset or CGU, the
estimated future cash flows are discounted to their present value using a discount rate that reflects current market
assessments of the time value of money and the risks specific to the asset or CGU. An impairment loss is recognized if
the recoverable amount is lower than the carrying amount.
When an impairment loss for assets, other than Goodwill, no longer exists or has decreased, the carrying amount of the
asset or CGU is increased to the revised estimate of its recoverable amount, but not in excess of the carrying amount that
would have been recorded had no impairment loss been recognized. The reversal of an impairment loss is recognized in
the Consolidated Income Statement. Refer to the section —Use of Estimates below for additional information.