Chrysler 2015 Annual Report Download - page 195
Download and view the complete annual report
Please find page 195 of the 2015 Chrysler annual report below. You can navigate through the pages in the report by either clicking on the pages listed below, or by using the keyword search tool below to find specific information within the annual report.-
 1
1 -
2
-
3
-
4
-
5
-
6
-
7
-
8
-
9
-
10
-
11
-
12
-
13
-
14
-
15
-
16
-
17
-
18
-
19
-
20
-
21
-
22
-
23
-
24
-
25
-
26
-
27
-
28
-
29
-
30
-
31
-
32
-
33
-
34
-
35
-
36
-
37
-
38
-
39
-
40
-
41
-
42
-
43
-
44
-
45
-
46
-
47
-
48
-
49
-
50
-
51
-
52
-
53
-
54
-
55
-
56
-
57
-
58
-
59
-
60
-
61
-
62
-
63
-
64
-
65
-
66
-
67
-
68
-
69
-
70
-
71
-
72
-
73
-
74
-
75
-
76
-
77
-
78
-
79
-
80
-
81
-
82
-
83
-
84
-
85
-
86
-
87
-
88
-
89
-
90
-
91
-
92
-
93
-
94
-
95
-
96
-
97
-
98
-
99
-
100
-
101
-
102
-
103
-
104
-
105
-
106
-
107
-
108
-
109
-
110
-
111
-
112
-
113
-
114
-
115
-
116
-
117
-
118
-
119
-
120
-
121
-
122
-
123
-
124
-
125
-
126
-
127
-
128
-
129
-
130
-
131
-
132
-
133
-
134
-
135
-
136
-
137
-
138
-
139
-
140
-
141
-
142
-
143
-
144
-
145
-
146
-
147
-
148
-
149
-
150
-
151
-
152
-
153
-
154
-
155
-
156
-
157
-
158
-
159
-
160
-
161
-
162
-
163
-
164
-
165
-
166
-
167
-
168
-
169
-
170
-
171
-
172
-
173
-
174
-
175
-
176
-
177
-
178
-
179
-
180
-
181
-
182
-
183
-
184
-
 185
185 -
 186
186 -
 187
187 -
 188
188 -
 189
189 -
 190
190 -
 191
191 -
 192
192 -
 193
193 -
 194
194 -
 195
195 -
 196
196 -
 197
197 -
 198
198 -
 199
199 -
 200
200 -
 201
201 -
 202
202 -
 203
203 -
 204
204 -
 205
205 -
206
-
207
-
208
-
209
-
210
-
211
-
212
-
213
-
214
-
215
-
216
-
217
-
218
-
219
-
220
-
221
-
222
-
223
-
224
-
225
-
226
-
227
-
228
-
229
-
230
-
231
-
232
-
233
-
234
-
235
-
236
-
237
-
238
-
239
-
240
-
241
-
242
-
243
-
244
-
245
-
246
-
247
-
248
-
249
-
250
-
251
-
252
-
253
-
254
-
255
-
256
-
257
-
258
-
259
-
260
-
261
-
262
-
263
-
264
-
265
-
266
-
267
-
268
-
269
-
270
-
271
-
272
-
273
-
274
-
275
-
276
-
277
-
278
-
279
-
280
-
281
-
282
-
283
-
284
-
285
-
286
-
287
-
288
 |
 |

2015 | ANNUAL REPORT 195
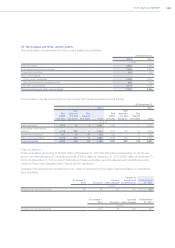
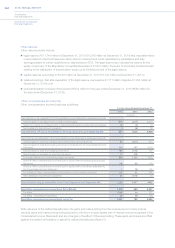
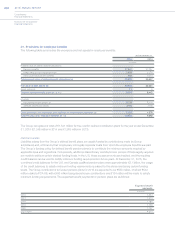
The following table summarizes the tax effect relating to Other comprehensive income/(loss):
For the Years Ended December 31,
2015 2014 2013
Pre-tax
balance
Tax
income/
(expense)
Net
balance
Pre-tax
balance
Tax
income/
(expense)
Net
balance
Pre-tax
balance
Tax
income/
(expense)
Net
balance
(€ million)
Gains/(losses) on
remeasurement of defined
benefit plans 679 (201) 478 (327) 28 (299) 2,679 237 2,916
Gains/(losses) on cash flow
hedging instruments 186 (48) 138 (144) 26 (118) 107 (10) 97
Gains/(losses) on available-
for-sale financial assets 11 — 11 (24) — (24) 4 — 4
Exchange gains/(losses)
on translating foreign
operations 928 — 928 1,255 — 1,255 (708) — (708)
Share of Other
comprehensive income/(loss)
for equity method investees (19) — (19) 47 — 47 (95) — (95)
Items relating to
discontinued operations 25 (4) 21 (127) 48 (79) 40 (15) 25
Total Other comprehensive
income/(loss) 1,810 (253) 1,557 680 102 782 2,027 212 2,239
Policies and processes for managing capital
The objectives identified by the Group for managing capital are to create value for shareholders as a whole, safeguard
business continuity and support the growth of the Group. As a result, the Group endeavors to maintain an adequate
level of capital that at the same time enables it to obtain a satisfactory economic return for its shareholders and
guarantee economic access to external sources of funds, including by means of achieving an adequate credit rating.
The Group constantly monitors the ratio between debt and equity, particularly the level of net debt and the generation
of cash from its industrial activities. In order to reach these objectives, the Group continues to aim for improvement in
the profitability of its operations. Furthermore, the Group may sell part of its assets to reduce the level of its debt, while
the Board of Directors may make proposals to FCA shareholders in the general meeting to reduce or increase share
capital or, where permitted by law, to distribute reserves. The Group may also make purchases of treasury shares,
without exceeding the limits authorized by FCA shareholders in the general meeting, under the same logic of creating
value, compatible with the objectives of achieving financial equilibrium and an improvement in the Group’s rating.
For 2015, the Board of Directors has not recommended a dividend payment on FCA common shares in order to
further fund capital requirements of the Group’s business plan.
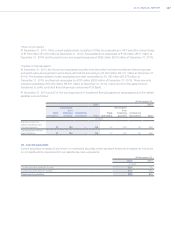
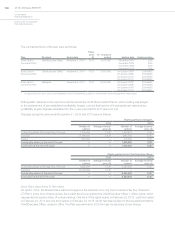
The FCA loyalty voting structure
The purpose of the loyalty voting structure is to reward long-term ownership of FCA common shares and to promote
stability of the FCA shareholder base by granting long-term FCA shareholders with special voting shares to which
one voting right is attached additional to the one granted by each FCA common share that they hold. In connection
with the Merger, FCA issued 408,941,767 special voting shares, with a nominal value of €0.01 each, to those eligible
shareholders of Fiat who had elected to participate in the loyalty voting structure upon completion of the Merger in
addition to FCA common shares. In addition, an FCA shareholder may at any time elect to participate in the loyalty
voting structure by requesting that FCA register all or some of the number of FCA common shares held by such
FCA shareholder in the Loyalty Register. Only a minimal dividend accrues to the special voting shares allocated to a
separate special dividend reserve, and they shall not carry any entitlement to any other reserve of FCA. Having only
immaterial economics entitlements, the special voting shares do not impact earnings per share.