Chrysler 2015 Annual Report Download - page 60
Download and view the complete annual report
Please find page 60 of the 2015 Chrysler annual report below. You can navigate through the pages in the report by either clicking on the pages listed below, or by using the keyword search tool below to find specific information within the annual report.-
 1
1 -
2
-
3
-
4
-
5
-
6
-
7
-
8
-
9
-
10
-
11
-
12
-
13
-
14
-
15
-
16
-
17
-
18
-
19
-
20
-
21
-
22
-
23
-
24
-
25
-
26
-
27
-
28
-
29
-
30
-
31
-
32
-
33
-
34
-
35
-
36
-
37
-
38
-
39
-
40
-
41
-
42
-
43
-
44
-
45
-
46
-
47
-
48
-
49
-
 50
50 -
 51
51 -
 52
52 -
 53
53 -
 54
54 -
 55
55 -
 56
56 -
 57
57 -
 58
58 -
 59
59 -
 60
60 -
 61
61 -
 62
62 -
 63
63 -
 64
64 -
 65
65 -
 66
66 -
 67
67 -
 68
68 -
 69
69 -
 70
70 -
71
-
72
-
73
-
74
-
75
-
76
-
77
-
78
-
79
-
80
-
81
-
82
-
83
-
84
-
85
-
86
-
87
-
88
-
89
-
90
-
91
-
92
-
93
-
94
-
95
-
96
-
97
-
98
-
99
-
100
-
101
-
102
-
103
-
104
-
105
-
106
-
107
-
108
-
109
-
110
-
111
-
112
-
113
-
114
-
115
-
116
-
117
-
118
-
119
-
120
-
121
-
122
-
123
-
124
-
125
-
126
-
127
-
128
-
129
-
130
-
131
-
132
-
133
-
134
-
135
-
136
-
137
-
138
-
139
-
140
-
141
-
142
-
143
-
144
-
145
-
146
-
147
-
148
-
149
-
150
-
151
-
152
-
153
-
154
-
155
-
156
-
157
-
158
-
159
-
160
-
161
-
162
-
163
-
164
-
165
-
166
-
167
-
168
-
169
-
170
-
171
-
172
-
173
-
174
-
175
-
176
-
177
-
178
-
179
-
180
-
181
-
182
-
183
-
184
-
185
-
186
-
187
-
188
-
189
-
190
-
191
-
192
-
193
-
194
-
195
-
196
-
197
-
198
-
199
-
200
-
201
-
202
-
203
-
204
-
205
-
206
-
207
-
208
-
209
-
210
-
211
-
212
-
213
-
214
-
215
-
216
-
217
-
218
-
219
-
220
-
221
-
222
-
223
-
224
-
225
-
226
-
227
-
228
-
229
-
230
-
231
-
232
-
233
-
234
-
235
-
236
-
237
-
238
-
239
-
240
-
241
-
242
-
243
-
244
-
245
-
246
-
247
-
248
-
249
-
250
-
251
-
252
-
253
-
254
-
255
-
256
-
257
-
258
-
259
-
260
-
261
-
262
-
263
-
264
-
265
-
266
-
267
-
268
-
269
-
270
-
271
-
272
-
273
-
274
-
275
-
276
-
277
-
278
-
279
-
280
-
281
-
282
-
283
-
284
-
285
-
286
-
287
-
288
 |
 |

60 2015 | ANNUAL REPORT
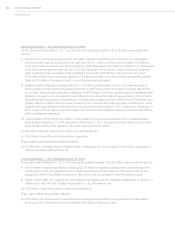
Operating Results
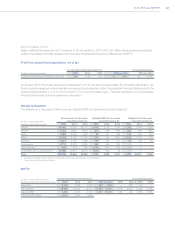
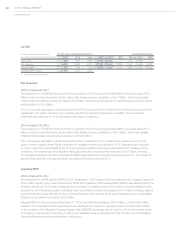
LATAM
(€ million, except percentages and
shipments which are in thousands of units)
For the Years Ended December 31, Increase/(decrease)
2015 2014 2013 2015 vs. 2014 CER 2014 vs. 2013 CER
Shipments 553 827 950 (274) (33.1)% — (123) (12.9)% —
Net revenues 6,431 8,629 9,973 (2,198) (25.5)% (17.8)% (1,344) (13.5)% (6.9)%
Adjusted EBIT (87) 289 619 (376) n.m.(1) n.m.(1) (330) (53.3)% (45.1)%
Adjusted EBIT margin (1.4)% 3.3% 6.2%
(1) Number is not meaningful.
Net revenues
2015 compared to 2014
The decrease in LATAM Net revenues in 2015 compared to 2014 was primarily attributable to (i) a decrease of €2.3
billion driven by lower shipments and (ii) unfavorable foreign currency translation of €0.7 billion, which was partially
offset by (iii) a favorable product mix impact of €0.5 billion driven by the all-new 2015 Jeep Renegade and (iv) positive
pricing actions of €0.3 billion.
The 33.1 percent decrease in vehicle shipments in 2015 compared to 2014 reflected the continued macroeconomic
weakness in the region resulting in poor trading conditions in Brazil and Argentina. In addition, the decrease in
shipments also was due to continued import restrictions in Argentina.
2014 compared to 2013
The decrease in LATAM Net revenues in 2014 compared to 2013 was primarily attributable to (i) a decrease of €1.2
billion driven by lower shipments and (ii) unfavorable foreign currency translation of €0.7 billion, which was partially
offset by (iii) favorable net pricing and vehicle mix of €0.6 billion.
The 12.9 percent decrease in vehicle shipments in 2014 compared to 2013 reflected the weaker demand in the
region’s main markets, where Brazil continued the negative market trend started in 2012, Argentina was impacted
by import restrictions and additional tax on more expensive vehicles and Venezuela suffered from weaker trading
conditions. The weakening of the Brazilian Real against the Euro impacted Net revenues by €0.6 billion, whereby
the average exchange rate used to translate Brazilian Real balances for the year ended December 31, 2014 was 8.9
percent lower than the average exchange rate used for the same period in 2013.
Adjusted EBIT
2015 compared to 2014
The decrease in LATAM Adjusted EBIT in 2015 compared to 2014 was primarily attributable to (i) a negative impact of
€344 million resulting from lower shipments in Brazil and Argentina, which was partially offset by favorable product mix
driven by the all-new 2015 Jeep Renegade, (ii) an increase in industrial costs of €216 million primarily relating to start-
up costs for the Pernambuco plant and higher input cost inflation and (iii) an increase of €125 million in Selling, general
and administrative costs primarily for the commercial launch of the all-new 2015 Jeep Renegade, which was partially
offset by (iv) favorable net pricing of €279 million.
Adjusted EBIT for the year ended December31, 2015 excluded total charges of €219 million, of which €83 million
related to the devaluation of the Argentinian Peso resulting from changes in monetary policy and €80 million related
to the adoption of the Marginal Currency System (the “SIMADI”) exchange rate at June 30, 2015 and the write-down
of inventory in Venezuela to the lower of cost or net realizable value as described in Note 30 within our Consolidated
Financial Statements included elsewhere in this report.