Chrysler 2015 Annual Report Download - page 58
Download and view the complete annual report
Please find page 58 of the 2015 Chrysler annual report below. You can navigate through the pages in the report by either clicking on the pages listed below, or by using the keyword search tool below to find specific information within the annual report.-
 1
1 -
2
-
3
-
4
-
5
-
6
-
7
-
8
-
9
-
10
-
11
-
12
-
13
-
14
-
15
-
16
-
17
-
18
-
19
-
20
-
21
-
22
-
23
-
24
-
25
-
26
-
27
-
28
-
29
-
30
-
31
-
32
-
33
-
34
-
35
-
36
-
37
-
38
-
39
-
40
-
41
-
42
-
43
-
44
-
45
-
46
-
47
-
 48
48 -
 49
49 -
 50
50 -
 51
51 -
 52
52 -
 53
53 -
 54
54 -
 55
55 -
 56
56 -
 57
57 -
 58
58 -
 59
59 -
 60
60 -
 61
61 -
 62
62 -
 63
63 -
 64
64 -
 65
65 -
 66
66 -
 67
67 -
 68
68 -
69
-
70
-
71
-
72
-
73
-
74
-
75
-
76
-
77
-
78
-
79
-
80
-
81
-
82
-
83
-
84
-
85
-
86
-
87
-
88
-
89
-
90
-
91
-
92
-
93
-
94
-
95
-
96
-
97
-
98
-
99
-
100
-
101
-
102
-
103
-
104
-
105
-
106
-
107
-
108
-
109
-
110
-
111
-
112
-
113
-
114
-
115
-
116
-
117
-
118
-
119
-
120
-
121
-
122
-
123
-
124
-
125
-
126
-
127
-
128
-
129
-
130
-
131
-
132
-
133
-
134
-
135
-
136
-
137
-
138
-
139
-
140
-
141
-
142
-
143
-
144
-
145
-
146
-
147
-
148
-
149
-
150
-
151
-
152
-
153
-
154
-
155
-
156
-
157
-
158
-
159
-
160
-
161
-
162
-
163
-
164
-
165
-
166
-
167
-
168
-
169
-
170
-
171
-
172
-
173
-
174
-
175
-
176
-
177
-
178
-
179
-
180
-
181
-
182
-
183
-
184
-
185
-
186
-
187
-
188
-
189
-
190
-
191
-
192
-
193
-
194
-
195
-
196
-
197
-
198
-
199
-
200
-
201
-
202
-
203
-
204
-
205
-
206
-
207
-
208
-
209
-
210
-
211
-
212
-
213
-
214
-
215
-
216
-
217
-
218
-
219
-
220
-
221
-
222
-
223
-
224
-
225
-
226
-
227
-
228
-
229
-
230
-
231
-
232
-
233
-
234
-
235
-
236
-
237
-
238
-
239
-
240
-
241
-
242
-
243
-
244
-
245
-
246
-
247
-
248
-
249
-
250
-
251
-
252
-
253
-
254
-
255
-
256
-
257
-
258
-
259
-
260
-
261
-
262
-
263
-
264
-
265
-
266
-
267
-
268
-
269
-
270
-
271
-
272
-
273
-
274
-
275
-
276
-
277
-
278
-
279
-
280
-
281
-
282
-
283
-
284
-
285
-
286
-
287
-
288
 |
 |

58 2015 | ANNUAL REPORT
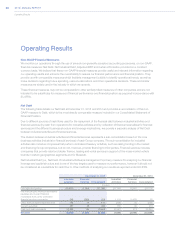
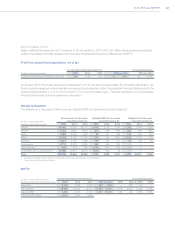
Operating Results
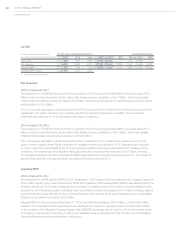
Net revenues
2015 compared to 2014
The increase in NAFTA Net revenues in 2015 compared to 2014 was primarily attributable to (i) an increase in volumes
of €5.0 billion, (ii) positive net pricing of €0.7 billion and (iii) favorable foreign currency translation effects of €10.7 billion.
The 9.3 percent increase in vehicle shipments in 2015 compared to 2014 was driven by increased demand for the
Jeep and Ram brands, led by the all-new 2015 Jeep Renegade and the Jeep Cherokee.
The €0.7 billion impact resulting from favorable net pricing reflected positive pricing and dealer discount reductions
that were partially offset by incentives and foreign exchange transaction effects.
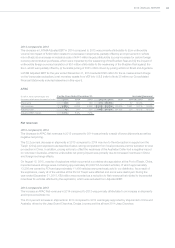
2014 compared to 2013
The increase in NAFTA Net revenues in 2014 compared to 2013 was primarily attributable to (i) an increase in
shipments of €4.4 billion, (ii) favorable market and vehicle mix of €1.9 billion and (iii) favorable net pricing of €0.4 billion.
The 11.4 percent increase in vehicle shipments was largely driven by increased demand for the Group’s vehicles,
including the all-new 2014 Jeep Cherokee, Ram pickups and the Jeep Grand Cherokee. These increases were
partially offset by a reduction in the prior model year Chrysler 200 and Dodge Avenger shipments due to their
discontinued production in the first quarter of 2014 in preparation for the launch and changeover to the all-new 2015
Chrysler 200, which began arriving in dealerships in May 2014.
Of the favorable mix impact of €1.9 billion, €1.7 billion related to vehicle mix due to a higher proportion of trucks and
certain SUVs as compared to passenger cars (as these larger vehicles generally have a higher selling price), and €0.2
billion related to a shift in distribution channel mix to greater retail shipments as a percentage of total shipments, which
is consistent with the continuing strategy to grow the U.S. retail market share while maintaining stable fleet shipments.
Favorable net pricing of €0.4 billion reflected favorable pricing and pricing for enhanced content, partially offset by
incentive spending on certain vehicles in the portfolio.
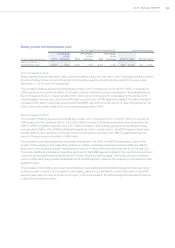
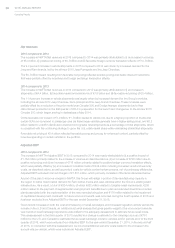
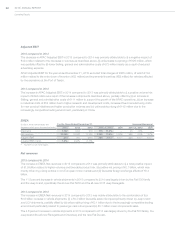
Adjusted EBIT
2015 compared to 2014
The increase in NAFTA Adjusted EBIT in 2015 compared to 2014 was mainly attributable to (i) a positive impact of
€1,164 million primarily related to the increase in volumes as described above, (ii) an increase of €736 million due to
positive net pricing and (iii) an increase of €718 million primarily related to positive foreign currency translation effects,
which was partially offset by (iv) an increase in industrial costs of €342 million including increased recall and warranty
costs, as described below, as well as product costs for vehicle content enhancements, net of purchasing efficiencies.
Adjusted EBIT excluded total net charges of €1,631 million, which primarily consisted of the items discussed below.
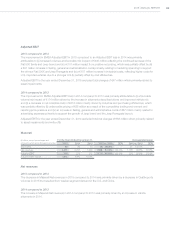
As part of the plan to improve margins in NAFTA, the Group will realign a portion of its manufacturing capacity in
the region to better meet market demand for Ram pickup trucks and Jeep vehicles within the Group’s existing plant
infrastructure. As a result, a total of €834 million, of which €422 million related to tangible asset impairments, €236
million related to the payment of supplemental unemployment benefits due to planned extended downtime at certain
plants associated with the implementation of the new manufacturing plan and €176 million related to the impairment
of capitalized development costs with no future economic benefit, was recorded during the fourth quarter of 2015 and
has been excluded from Adjusted EBIT for the year ended December 31, 2015.
Given recent increases in both the cost and frequency of recall campaigns and increased regulatory activity across the
industry in the U.S and Canada, an additional actuarial analysis that gives greater weight to the more recent calendar
year trends in recall campaign experience was added to the adequacy assessment to estimatefuture recall costs.
This reassessment in the third quarter of 2015 resulted in a change in estimate for the campaign accrual of €761
million for the U.S. and Canada for estimated future recall campaign costs for vehicles sold in periods prior to the third
quarter of 2015, which was excluded from Adjusted EBIT for the year ended December 31, 2015. In the second half
of 2015, in connection with this reassessment, we incurred additional warranty costs related to the increase in the
accrual rate per vehicle, which were included in Adjusted EBIT.