Chrysler 2015 Annual Report Download - page 218
Download and view the complete annual report
Please find page 218 of the 2015 Chrysler annual report below. You can navigate through the pages in the report by either clicking on the pages listed below, or by using the keyword search tool below to find specific information within the annual report.-
 1
1 -
2
-
3
-
4
-
5
-
6
-
7
-
8
-
9
-
10
-
11
-
12
-
13
-
14
-
15
-
16
-
17
-
18
-
19
-
20
-
21
-
22
-
23
-
24
-
25
-
26
-
27
-
28
-
29
-
30
-
31
-
32
-
33
-
34
-
35
-
36
-
37
-
38
-
39
-
40
-
41
-
42
-
43
-
44
-
45
-
46
-
47
-
48
-
49
-
50
-
51
-
52
-
53
-
54
-
55
-
56
-
57
-
58
-
59
-
60
-
61
-
62
-
63
-
64
-
65
-
66
-
67
-
68
-
69
-
70
-
71
-
72
-
73
-
74
-
75
-
76
-
77
-
78
-
79
-
80
-
81
-
82
-
83
-
84
-
85
-
86
-
87
-
88
-
89
-
90
-
91
-
92
-
93
-
94
-
95
-
96
-
97
-
98
-
99
-
100
-
101
-
102
-
103
-
104
-
105
-
106
-
107
-
108
-
109
-
110
-
111
-
112
-
113
-
114
-
115
-
116
-
117
-
118
-
119
-
120
-
121
-
122
-
123
-
124
-
125
-
126
-
127
-
128
-
129
-
130
-
131
-
132
-
133
-
134
-
135
-
136
-
137
-
138
-
139
-
140
-
141
-
142
-
143
-
144
-
145
-
146
-
147
-
148
-
149
-
150
-
151
-
152
-
153
-
154
-
155
-
156
-
157
-
158
-
159
-
160
-
161
-
162
-
163
-
164
-
165
-
166
-
167
-
168
-
169
-
170
-
171
-
172
-
173
-
174
-
175
-
176
-
177
-
178
-
179
-
180
-
181
-
182
-
183
-
184
-
185
-
186
-
187
-
188
-
189
-
190
-
191
-
192
-
193
-
194
-
195
-
196
-
197
-
198
-
199
-
200
-
201
-
202
-
203
-
204
-
205
-
206
-
207
-
 208
208 -
 209
209 -
 210
210 -
 211
211 -
 212
212 -
 213
213 -
 214
214 -
 215
215 -
 216
216 -
 217
217 -
 218
218 -
 219
219 -
 220
220 -
 221
221 -
 222
222 -
 223
223 -
 224
224 -
 225
225 -
 226
226 -
 227
227 -
 228
228 -
229
-
230
-
231
-
232
-
233
-
234
-
235
-
236
-
237
-
238
-
239
-
240
-
241
-
242
-
243
-
244
-
245
-
246
-
247
-
248
-
249
-
250
-
251
-
252
-
253
-
254
-
255
-
256
-
257
-
258
-
259
-
260
-
261
-
262
-
263
-
264
-
265
-
266
-
267
-
268
-
269
-
270
-
271
-
272
-
273
-
274
-
275
-
276
-
277
-
278
-
279
-
280
-
281
-
282
-
283
-
284
-
285
-
286
-
287
-
288
 |
 |

218 2015 | ANNUAL REPORT
Consolidated
Financial Statements
Notes to the Consolidated
Financial Statements
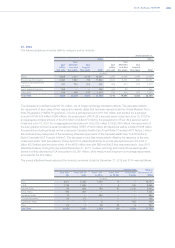
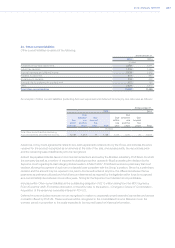
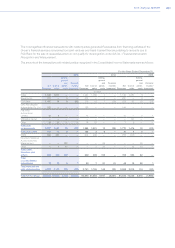
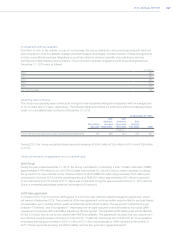
25. Fair Value measurement
Assets and liabilities that are measured at fair value on a recurring basis
The following table shows the fair value hierarchy for financial assets and liabilities that are measured at fair value on a
recurring basis at December31, 2015 and December 31, 2014:
At December 31, 2015 At December 31, 2014
Level 1 Level2 Level3 Total Level 1 Level2 Level3 Total
Note (€ million)
Assets at fair value available-for-sale:
Investments at fair value with
changes directly in Other
comprehensive income/(loss) (13) 184 19 — 203 110 14 — 124
Other non-current securities (13) 31 — 12 43 45 — 22 67
Current securities available-for-sale (16) 264 5 — 269 30 — — 30
Financial assets at fair value
held-for-trading: —
Current investments 48 — — 48 36 — — 36
Current securities held for trading (16) 213 — — 213 180 — — 180
Other financial assets (17) 40 813 — 853 38 473 4 515
Cash and cash equivalents (18) 18,097 2,565 — 20,662 20,804 2,036 — 22,840
Total Assets 18,877 3,402 12 22,291 21,243 2,523 26 23,792
Other financial liabilities (17) — 701 35 736 — 740 8 748
Total Liabilities — 701 35 736 — 740 8 748
In 2015, there were no transfers between Levels in the fair value hierarchy.
The fair value of Other financial assets and liabilities, which mainly include derivatives financial instruments, is
measured by taking into consideration market parameters at the balance sheet date and using valuation techniques
widely accepted in the financial business environment. In particular:
the fair value of forward contracts and currency swaps is determined by taking the prevailing exchange rates and
interest rates at the balance sheet date;
the fair value of interest rate swaps and forward rate agreements is determined by taking the prevailing interest rates
at the balance sheet date and using the discounted expected cash flow method;
the fair value of combined interest rate and currency swaps is determined using the exchange and interest rates
prevailing at the balance sheet date and the discounted expected cash flow method;
the fair value of swaps and options hedging commodity price risk is determined by using suitable valuation
techniques and taking market parameters at the balance sheet date (in particular, underlying prices, interest rates
and volatility rates).
The carrying value of Cash and cash equivalents (Note 18) usually approximates fair value due to the short maturity
of these instruments. The fair value of money market funds is also based on available market quotations. Where
appropriate, the fair value of cash equivalents is determined with discounted expected cash flow techniques using
observable market yields (categorized as Level 2).