Chrysler 2015 Annual Report Download - page 11
Download and view the complete annual report
Please find page 11 of the 2015 Chrysler annual report below. You can navigate through the pages in the report by either clicking on the pages listed below, or by using the keyword search tool below to find specific information within the annual report.-
 1
1 -
 2
2 -
 3
3 -
 4
4 -
 5
5 -
 6
6 -
 7
7 -
 8
8 -
 9
9 -
 10
10 -
 11
11 -
 12
12 -
 13
13 -
 14
14 -
 15
15 -
 16
16 -
 17
17 -
 18
18 -
 19
19 -
 20
20 -
 21
21 -
 22
22 -
23
-
24
-
25
-
26
-
27
-
28
-
29
-
30
-
31
-
32
-
33
-
34
-
35
-
36
-
37
-
38
-
39
-
40
-
41
-
42
-
43
-
44
-
45
-
46
-
47
-
48
-
49
-
50
-
51
-
52
-
53
-
54
-
55
-
56
-
57
-
58
-
59
-
60
-
61
-
62
-
63
-
64
-
65
-
66
-
67
-
68
-
69
-
70
-
71
-
72
-
73
-
74
-
75
-
76
-
77
-
78
-
79
-
80
-
81
-
82
-
83
-
84
-
85
-
86
-
87
-
88
-
89
-
90
-
91
-
92
-
93
-
94
-
95
-
96
-
97
-
98
-
99
-
100
-
101
-
102
-
103
-
104
-
105
-
106
-
107
-
108
-
109
-
110
-
111
-
112
-
113
-
114
-
115
-
116
-
117
-
118
-
119
-
120
-
121
-
122
-
123
-
124
-
125
-
126
-
127
-
128
-
129
-
130
-
131
-
132
-
133
-
134
-
135
-
136
-
137
-
138
-
139
-
140
-
141
-
142
-
143
-
144
-
145
-
146
-
147
-
148
-
149
-
150
-
151
-
152
-
153
-
154
-
155
-
156
-
157
-
158
-
159
-
160
-
161
-
162
-
163
-
164
-
165
-
166
-
167
-
168
-
169
-
170
-
171
-
172
-
173
-
174
-
175
-
176
-
177
-
178
-
179
-
180
-
181
-
182
-
183
-
184
-
185
-
186
-
187
-
188
-
189
-
190
-
191
-
192
-
193
-
194
-
195
-
196
-
197
-
198
-
199
-
200
-
201
-
202
-
203
-
204
-
205
-
206
-
207
-
208
-
209
-
210
-
211
-
212
-
213
-
214
-
215
-
216
-
217
-
218
-
219
-
220
-
221
-
222
-
223
-
224
-
225
-
226
-
227
-
228
-
229
-
230
-
231
-
232
-
233
-
234
-
235
-
236
-
237
-
238
-
239
-
240
-
241
-
242
-
243
-
244
-
245
-
246
-
247
-
248
-
249
-
250
-
251
-
252
-
253
-
254
-
255
-
256
-
257
-
258
-
259
-
260
-
261
-
262
-
263
-
264
-
265
-
266
-
267
-
268
-
269
-
270
-
271
-
272
-
273
-
274
-
275
-
276
-
277
-
278
-
279
-
280
-
281
-
282
-
283
-
284
-
285
-
286
-
287
-
288
 |
 |

2015 | ANNUAL REPORT 11
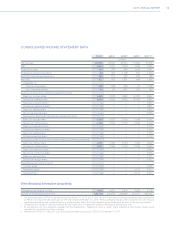
CONSOLIDATED INCOME STATEMENT DATA
2015(1) 2014(1) 2013(1) 2012(1) 2011(1),(4)
(€ million)
Net revenues 110,595 93,640 84,530 81,665 57,605
EBIT 2,625 2,834 2,638 3,099 2,993
Profit before taxes 259 783 649 1,190 1,631
Profit from continuing operations 93 359 1,708 661 1,203
Profit from discontinued operations 284 273 243 235 195
Net profit 377 632 1,951 896 1,398
Attributable to:
Owners of the parent 334 568 904 44 1,199
Non-controlling interest 43 64 1,047 852 199
Earnings per share from continuing operations (in Euro)
Basic per ordinary share 0.055 0.268 0.568 (0.132) 0.827
Diluted per ordinary share 0.055 0.265 0.562 (0.130) 0.821
Basic per preference share —— — — 0.827
Diluted per preference share —— — — 0.821
Basic per savings share —— — — 0.935
Diluted per savings share —— — — 0.929
Earnings per share from discontinued operations (in Euro)
Basic per ordinary share 0.166 0.197 0.176 0.168 0.135
Diluted per ordinary share 0.166 0.195 0.174 0.166 0.134
Basic per preference share —— — — 0.135
Diluted per preference share —— — — 0.134
Basic per savings share —— — — 0.136
Diluted per savings share —— — — 0.134
Earnings per share (in Euro) from continuing and discontinued operations
Basic per ordinary share 0.221 0.465 0.744 0.036 0.962
Diluted per ordinary share 0.221 0.460 0.736 0.036 0.955
Basic per preference share —— — — 0.962
Diluted per preference share —— — — 0.955
Basic per savings share —— — — 1.071
Diluted per savings share —— — — 1.063
Dividends paid per share (in Euro)(2)
Ordinary share —— — — 0.090
Preference share(3) —— — 0.217 0.310
Savings share(3) —— — 0.217 0.310
Other Statistical Information (unaudited):
Shipments (in thousands of units) 4,602 4,601 4,345 4,223 3,175
Number of employees at period end 238,162 232,165 229,053 218,311 197,021
(1) The operating results of FCA for the years ended December 31, 2014, 2013, 2012 and 2011 have been re-presented following the classification
of Ferrari as a discontinued operation for the year ended December 31, 2015; Ferrari operating results were excluded from the Group’s
continuing operations and are presented as a single line item within the Consolidated Income Statements for each of the years presented.
(2) Dividends paid represent cash payments in the applicable year that generally relates to earnings of the previous year.
(3) In accordance with the resolution adopted by the shareholders’ meeting on April4, 2012, Fiat’s preference and savings shares were
mandatorily converted into ordinary shares.
(4) Numbers from Form F-1 filed with U.S. Securities Exchange Commission (“SEC”) on December 4, 2014.