Chrysler 2015 Annual Report Download - page 158
Download and view the complete annual report
Please find page 158 of the 2015 Chrysler annual report below. You can navigate through the pages in the report by either clicking on the pages listed below, or by using the keyword search tool below to find specific information within the annual report.-
 1
1 -
2
-
3
-
4
-
5
-
6
-
7
-
8
-
9
-
10
-
11
-
12
-
13
-
14
-
15
-
16
-
17
-
18
-
19
-
20
-
21
-
22
-
23
-
24
-
25
-
26
-
27
-
28
-
29
-
30
-
31
-
32
-
33
-
34
-
35
-
36
-
37
-
38
-
39
-
40
-
41
-
42
-
43
-
44
-
45
-
46
-
47
-
48
-
49
-
50
-
51
-
52
-
53
-
54
-
55
-
56
-
57
-
58
-
59
-
60
-
61
-
62
-
63
-
64
-
65
-
66
-
67
-
68
-
69
-
70
-
71
-
72
-
73
-
74
-
75
-
76
-
77
-
78
-
79
-
80
-
81
-
82
-
83
-
84
-
85
-
86
-
87
-
88
-
89
-
90
-
91
-
92
-
93
-
94
-
95
-
96
-
97
-
98
-
99
-
100
-
101
-
102
-
103
-
104
-
105
-
106
-
107
-
108
-
109
-
110
-
111
-
112
-
113
-
114
-
115
-
116
-
117
-
118
-
119
-
120
-
121
-
122
-
123
-
124
-
125
-
126
-
127
-
128
-
129
-
130
-
131
-
132
-
133
-
134
-
135
-
136
-
137
-
138
-
139
-
140
-
141
-
142
-
143
-
144
-
145
-
146
-
147
-
 148
148 -
 149
149 -
 150
150 -
 151
151 -
 152
152 -
 153
153 -
 154
154 -
 155
155 -
 156
156 -
 157
157 -
 158
158 -
 159
159 -
 160
160 -
 161
161 -
 162
162 -
 163
163 -
 164
164 -
 165
165 -
 166
166 -
 167
167 -
 168
168 -
169
-
170
-
171
-
172
-
173
-
174
-
175
-
176
-
177
-
178
-
179
-
180
-
181
-
182
-
183
-
184
-
185
-
186
-
187
-
188
-
189
-
190
-
191
-
192
-
193
-
194
-
195
-
196
-
197
-
198
-
199
-
200
-
201
-
202
-
203
-
204
-
205
-
206
-
207
-
208
-
209
-
210
-
211
-
212
-
213
-
214
-
215
-
216
-
217
-
218
-
219
-
220
-
221
-
222
-
223
-
224
-
225
-
226
-
227
-
228
-
229
-
230
-
231
-
232
-
233
-
234
-
235
-
236
-
237
-
238
-
239
-
240
-
241
-
242
-
243
-
244
-
245
-
246
-
247
-
248
-
249
-
250
-
251
-
252
-
253
-
254
-
255
-
256
-
257
-
258
-
259
-
260
-
261
-
262
-
263
-
264
-
265
-
266
-
267
-
268
-
269
-
270
-
271
-
272
-
273
-
274
-
275
-
276
-
277
-
278
-
279
-
280
-
281
-
282
-
283
-
284
-
285
-
286
-
287
-
288
 |
 |

158 2015 | ANNUAL REPORT
Consolidated
Financial Statements
Notes to the Consolidated
Financial Statements
Expected contributions. The expected amount and timing of contributions is based on an assessment of minimum
funding requirements. From time to time contributions are made beyond those that are legally required.
Retirement rates. Retirement rates are developed to reflect actual and projected plan experience.
Mortality rates. Mortality rates are developed using our plan-specific populations, recent mortality information
published by recognized experts in this field, primarily the U.S. Society of Actuaries and the Canadian Institute of
Actuaries, and other data where appropriate to reflect actual and projected plan experience.
Plan assets measured at net asset value. Plan assets are recognized and measured at fair value in accordance
with IFRS 13 - Fair Value Measurement. Plan assets for which there are no active markets are represented by
the net asset value (“NAV”) and amounted to €3,000 million and €2,750 million at December 31, 2015 and 2014,
respectively. These investments include private equity, real estate and hedge fund investments.
Significant differences in actual experience or significant changes in assumptions may affect the pension obligations
and pension expense. The effects of actual results differing from assumptions and of amended assumptions are
included in Other comprehensive income/(loss). The weighted average discount rates used to determine the benefit
obligation for the defined benefit obligation for the defined benefit plan were 4.44 percent and 4.03 percent at
December 31, 2015 and 2014, respectively.
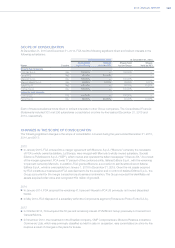
At December31, 2015 the effect of the indicated decrease or increase in the discount rate, holding all other
assumptions constant, is as follows:
Effect on pension
defined benefit
obligation
(€ million)
10 basis point decrease in discount rate 426
10 basis point increase in discount rate (418)
Refer to Note 21 for additional information on the Group’s pension plans.
Other post-employment benefits
The Group provides health care, legal, severance, indemnity life insurance benefits and other postretirement benefits
to certain hourly and salaried employees. Upon retirement, these employees may become eligible for continuation of
certain benefits. Benefits and eligibility rules may be modified periodically.
These postretirement employee benefits (or “OPEB”) are accounted for on an actuarial basis, which requires the
selection of various assumptions. The estimation of the Group’s obligations, costs and liabilities associated with OPEB
requires the use of estimates of the present value of the projected future payments to all participants, taking into
consideration the likelihood of potential future events estimated by using demographic assumptions such as mortality,
dismissal and retirement rates, which may have an effect on the amount and timing of future payments.
Plan obligations and costs are based on existing plan provisions. Assumptions regarding any potential future changes
to benefit provisions beyond those to which the Group is presently committed are not made.
The assumptions used in developing the required estimates include the following key factors:
Discount rates. Our discount rates are based on yields of high-quality (AA-rated) fixed income investments for which
the timing and amounts of maturities match the timing and amounts of the projected benefit payments.
Health care cost trends. The Group’s health care cost trend assumptions are developed based on historical cost
data, the near-term outlook, and an assessment of likely long-term trends.
Salary growth. The salary growth assumptions reflect the Group’s long-term actual experience, outlook and
assumed inflation.
Retirement and employee leaving rates. Retirement and employee leaving rates are developed to reflect actual and
projected plan experience, as well as legal requirements for retirement in respective countries.