Chrysler 2015 Annual Report Download - page 283
Download and view the complete annual report
Please find page 283 of the 2015 Chrysler annual report below. You can navigate through the pages in the report by either clicking on the pages listed below, or by using the keyword search tool below to find specific information within the annual report.-
 1
1 -
2
-
3
-
4
-
5
-
6
-
7
-
8
-
9
-
10
-
11
-
12
-
13
-
14
-
15
-
16
-
17
-
18
-
19
-
20
-
21
-
22
-
23
-
24
-
25
-
26
-
27
-
28
-
29
-
30
-
31
-
32
-
33
-
34
-
35
-
36
-
37
-
38
-
39
-
40
-
41
-
42
-
43
-
44
-
45
-
46
-
47
-
48
-
49
-
50
-
51
-
52
-
53
-
54
-
55
-
56
-
57
-
58
-
59
-
60
-
61
-
62
-
63
-
64
-
65
-
66
-
67
-
68
-
69
-
70
-
71
-
72
-
73
-
74
-
75
-
76
-
77
-
78
-
79
-
80
-
81
-
82
-
83
-
84
-
85
-
86
-
87
-
88
-
89
-
90
-
91
-
92
-
93
-
94
-
95
-
96
-
97
-
98
-
99
-
100
-
101
-
102
-
103
-
104
-
105
-
106
-
107
-
108
-
109
-
110
-
111
-
112
-
113
-
114
-
115
-
116
-
117
-
118
-
119
-
120
-
121
-
122
-
123
-
124
-
125
-
126
-
127
-
128
-
129
-
130
-
131
-
132
-
133
-
134
-
135
-
136
-
137
-
138
-
139
-
140
-
141
-
142
-
143
-
144
-
145
-
146
-
147
-
148
-
149
-
150
-
151
-
152
-
153
-
154
-
155
-
156
-
157
-
158
-
159
-
160
-
161
-
162
-
163
-
164
-
165
-
166
-
167
-
168
-
169
-
170
-
171
-
172
-
173
-
174
-
175
-
176
-
177
-
178
-
179
-
180
-
181
-
182
-
183
-
184
-
185
-
186
-
187
-
188
-
189
-
190
-
191
-
192
-
193
-
194
-
195
-
196
-
197
-
198
-
199
-
200
-
201
-
202
-
203
-
204
-
205
-
206
-
207
-
208
-
209
-
210
-
211
-
212
-
213
-
214
-
215
-
216
-
217
-
218
-
219
-
220
-
221
-
222
-
223
-
224
-
225
-
226
-
227
-
228
-
229
-
230
-
231
-
232
-
233
-
234
-
235
-
236
-
237
-
238
-
239
-
240
-
241
-
242
-
243
-
244
-
245
-
246
-
247
-
248
-
249
-
250
-
251
-
252
-
253
-
254
-
255
-
256
-
257
-
258
-
259
-
260
-
261
-
262
-
263
-
264
-
265
-
266
-
267
-
268
-
269
-
270
-
271
-
272
-
 273
273 -
 274
274 -
 275
275 -
 276
276 -
 277
277 -
 278
278 -
 279
279 -
 280
280 -
 281
281 -
 282
282 -
 283
283 -
 284
284 -
 285
285 -
 286
286 -
 287
287 -
 288
288
 |
 |

2015 | ANNUAL REPORT 283
Risk
Our audit response
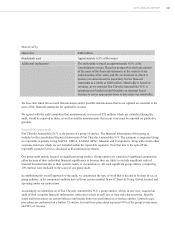
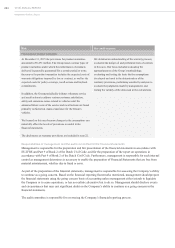
Valuation of non-current assets with definite and indefinite useful lives
At December 31, 2015 the recorded amount of goodwill and
other intangible assets with indefinite useful lives was €14,790
million; the majority of these assets relate to the NAFTA
segment. Non-current assets with definite useful lives include
property, plant and equipment, intangible assets and assets held
for sale. Intangible assets with definite useful lives mainly
consist of capitalized development costs related to the EMEA
and NAFTA segments.
The Company reviews the carrying amounts of these
non-current assets annually or more frequently when impairment
indicators are present. Estimating the recoverable amount of the
assets requires critical management judgment including
estimates of future sales, gross margins, operating costs,
terminal value growth rates, capital expenditures and the
discount rate and the assumptions inherent in those estimates.
The annual impairment test is significant to our audit because
the assessment process is complex and requires significant
judgment.
The Company disclosed the nature and value of the assumptions
used in the impairment analyses in note 10.
We designed our audit procedures to be responsive to
this risk. We obtained an understanding of the
impairment assessment processes and evaluated the
design and tested the effectiveness of controls in this
area relevant to our audit. Our focus included
evaluating the work of the management specialists
used for the valuation, evaluating and testing key
assumptions used in the valuation including projected
future income and earnings, performing sensitivity
analyses, and testing the allocation of the assets,
liabilities, revenues and expenses.
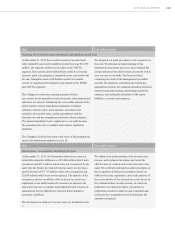
Risk
Our audit response
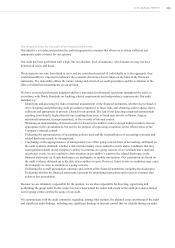
Income taxes -recoverability of deferred tax assets
At December 31, 2015, the Group had deferred tax assets on
deductible temporary differences of €9,606 million which were
recognized and €533 million which were not recognized. At the
same date the Group also had deferred tax assets on tax losses
carried forward of €3,717 million which were recognized and
€2,650 million which were not recognized. The analysis of the
recognition and recoverability of the deferred tax assets was
significant to our audit because the amounts are material, the
assessment process is complex and judgmental and is based on
assumptions that are affected by expected future market or
economic conditions.
The disclosures in relation to income taxes are included in note
7.
We obtained an understanding of the income taxes
process, and evaluated the design and tested the
effectiveness of controls in this area relevant to our
audit. We performed substantive audit procedures on
the recognition of deferred tax balances based on
different local tax regulations, and on the analysis of
the recoverability of the deferred tax assets based on
the estimated future taxable income, on which we
performed our audit procedures, principally by
performing sensitivity analyses and evaluating and
testing the key assumptions used to determine the
amounts recognized.