Chrysler 2015 Annual Report Download - page 159
Download and view the complete annual report
Please find page 159 of the 2015 Chrysler annual report below. You can navigate through the pages in the report by either clicking on the pages listed below, or by using the keyword search tool below to find specific information within the annual report.-
 1
1 -
2
-
3
-
4
-
5
-
6
-
7
-
8
-
9
-
10
-
11
-
12
-
13
-
14
-
15
-
16
-
17
-
18
-
19
-
20
-
21
-
22
-
23
-
24
-
25
-
26
-
27
-
28
-
29
-
30
-
31
-
32
-
33
-
34
-
35
-
36
-
37
-
38
-
39
-
40
-
41
-
42
-
43
-
44
-
45
-
46
-
47
-
48
-
49
-
50
-
51
-
52
-
53
-
54
-
55
-
56
-
57
-
58
-
59
-
60
-
61
-
62
-
63
-
64
-
65
-
66
-
67
-
68
-
69
-
70
-
71
-
72
-
73
-
74
-
75
-
76
-
77
-
78
-
79
-
80
-
81
-
82
-
83
-
84
-
85
-
86
-
87
-
88
-
89
-
90
-
91
-
92
-
93
-
94
-
95
-
96
-
97
-
98
-
99
-
100
-
101
-
102
-
103
-
104
-
105
-
106
-
107
-
108
-
109
-
110
-
111
-
112
-
113
-
114
-
115
-
116
-
117
-
118
-
119
-
120
-
121
-
122
-
123
-
124
-
125
-
126
-
127
-
128
-
129
-
130
-
131
-
132
-
133
-
134
-
135
-
136
-
137
-
138
-
139
-
140
-
141
-
142
-
143
-
144
-
145
-
146
-
147
-
148
-
 149
149 -
 150
150 -
 151
151 -
 152
152 -
 153
153 -
 154
154 -
 155
155 -
 156
156 -
 157
157 -
 158
158 -
 159
159 -
 160
160 -
 161
161 -
 162
162 -
 163
163 -
 164
164 -
 165
165 -
 166
166 -
 167
167 -
 168
168 -
 169
169 -
170
-
171
-
172
-
173
-
174
-
175
-
176
-
177
-
178
-
179
-
180
-
181
-
182
-
183
-
184
-
185
-
186
-
187
-
188
-
189
-
190
-
191
-
192
-
193
-
194
-
195
-
196
-
197
-
198
-
199
-
200
-
201
-
202
-
203
-
204
-
205
-
206
-
207
-
208
-
209
-
210
-
211
-
212
-
213
-
214
-
215
-
216
-
217
-
218
-
219
-
220
-
221
-
222
-
223
-
224
-
225
-
226
-
227
-
228
-
229
-
230
-
231
-
232
-
233
-
234
-
235
-
236
-
237
-
238
-
239
-
240
-
241
-
242
-
243
-
244
-
245
-
246
-
247
-
248
-
249
-
250
-
251
-
252
-
253
-
254
-
255
-
256
-
257
-
258
-
259
-
260
-
261
-
262
-
263
-
264
-
265
-
266
-
267
-
268
-
269
-
270
-
271
-
272
-
273
-
274
-
275
-
276
-
277
-
278
-
279
-
280
-
281
-
282
-
283
-
284
-
285
-
286
-
287
-
288
 |
 |

2015 | ANNUAL REPORT 159
Mortality rates. Mortality rates are developed using our plan-specific populations, recent mortality information
published by recognized experts in this field and other data where appropriate to reflect actual and projected
plan experience.
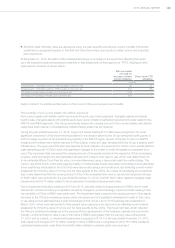
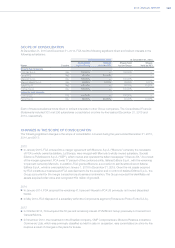
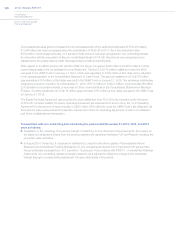
At December31, 2015, the effect of the indicated decreases or increases in the key factors affecting the health
care, life insurance plans and severance indemnity in Italy (trattamento di fine rapporto or “TFR”), holding all other
assumptions constant, is shown below:
Effectonhealth
careandlife
insurancedefined
benefit obligation
EffectontheTFR
obligation
(€ million)
10 basis point / (100 basis point for TFR) decrease in discount rate 32 41
10 basis point / (100 basis point for TFR) increase in discount rate (31) (38)
100 basis point decrease in health care cost trend rate (129) —
100 basis point increase in health care cost trend rate 157 —
Refer to Note 21 for additional information on the Group’s Other post-employment benefits.
Recoverability of non-current assets with definite useful lives
Non-current assets with definite useful lives include Property, plant and equipment, Intangible assets and Assets
held for sale. Intangible assets with definite useful lives mainly consist of capitalized development costs related to the
NAFTA and EMEA segments. The Group periodically reviews the carrying amount of non-current assets with definite
useful lives when events or circumstances indicate that an asset may be impaired.
During the year ended December 31, 2015, impairment losses totaling €713 million were recognized. The most
significant component of this impairment loss related to the decision taken by the Group during the fourth quarter of
2015 to realign a portion of its manufacturing capacity in the NAFTA region, as part of the plan to improve NAFTA
margins and to better meet market demand for Ram pickup trucks and Jeep vehicles within the Group’s existing plant
infrastructure. The approval of this plan was deemed to be an indicator of impairment for certain of our vehicle platform
cash generating units (“CGUs”) due to the significant changes to the extent to which the assets are expected to be
used. The impairment test compared the carrying amount of the assets included in the respective CGUs (comprising
property, plant and equipment and capitalized development costs) to their value in use, which was determined not
to be materially different from their fair value, and was determined using a discounted cash flow methodology. The
value in use of the CGUs, which was based primarily on unobservable inputs, was determined using pre-tax estimated
future cash flows attributable to the CGU that were discounted using a pre-tax discount rate reflecting current market
assessments of the time value of money and the risks specific to the CGUs. As a result of completing the impairment
test, it was determined that the carrying amount of the CGUs exceeded their value in use and an impairment charge
of €598 million was recorded for the year ended December 31, 2015, of which €422 million related to tangible asset
impairments and €176 million related to the impairment of capitalized development costs.
Due to impairment indicators existing in 2014 and 2013, primarily related to losses incurred in EMEA due to weak
demand for vehicles and strong competition as well as changes in product strategy, impairment tests relating to the
recoverability of CGUs in EMEA were performed. The impairment tests compared the carrying amount of the assets
allocated to the CGUs (comprising property, plant and equipment and capitalized development costs) to their value
in use using pre-tax estimated future cash flows based on the Group’s 2014-2018 business plan presented on
May 6, 2014, which were discounted to their present value using a pre-tax discount rate reflecting current market
assessments of the time value of money and the risks specific to the CGUs. The impairment test, which reflected
the Group’s available knowledge as to the expected future development of the business, markets and automotive
industry, confirmed that the value in use of the CGUs in EMEA was greater than the carrying value at December
31, 2014 and as a result, no impairment losses were recognized in 2014. For the year ended December31, 2013,
total impairment charges of €116 million relating to CGUs in EMEA were recognized of which €61 million related to
capitalized development costs (Note 4) and €55 million related to property, plant and equipment.