Chrysler 2015 Annual Report Download - page 68
Download and view the complete annual report
Please find page 68 of the 2015 Chrysler annual report below. You can navigate through the pages in the report by either clicking on the pages listed below, or by using the keyword search tool below to find specific information within the annual report.-
 1
1 -
2
-
3
-
4
-
5
-
6
-
7
-
8
-
9
-
10
-
11
-
12
-
13
-
14
-
15
-
16
-
17
-
18
-
19
-
20
-
21
-
22
-
23
-
24
-
25
-
26
-
27
-
28
-
29
-
30
-
31
-
32
-
33
-
34
-
35
-
36
-
37
-
38
-
39
-
40
-
41
-
42
-
43
-
44
-
45
-
46
-
47
-
48
-
49
-
50
-
51
-
52
-
53
-
54
-
55
-
56
-
57
-
 58
58 -
 59
59 -
 60
60 -
 61
61 -
 62
62 -
 63
63 -
 64
64 -
 65
65 -
 66
66 -
 67
67 -
 68
68 -
 69
69 -
 70
70 -
 71
71 -
 72
72 -
 73
73 -
 74
74 -
 75
75 -
 76
76 -
 77
77 -
 78
78 -
79
-
80
-
81
-
82
-
83
-
84
-
85
-
86
-
87
-
88
-
89
-
90
-
91
-
92
-
93
-
94
-
95
-
96
-
97
-
98
-
99
-
100
-
101
-
102
-
103
-
104
-
105
-
106
-
107
-
108
-
109
-
110
-
111
-
112
-
113
-
114
-
115
-
116
-
117
-
118
-
119
-
120
-
121
-
122
-
123
-
124
-
125
-
126
-
127
-
128
-
129
-
130
-
131
-
132
-
133
-
134
-
135
-
136
-
137
-
138
-
139
-
140
-
141
-
142
-
143
-
144
-
145
-
146
-
147
-
148
-
149
-
150
-
151
-
152
-
153
-
154
-
155
-
156
-
157
-
158
-
159
-
160
-
161
-
162
-
163
-
164
-
165
-
166
-
167
-
168
-
169
-
170
-
171
-
172
-
173
-
174
-
175
-
176
-
177
-
178
-
179
-
180
-
181
-
182
-
183
-
184
-
185
-
186
-
187
-
188
-
189
-
190
-
191
-
192
-
193
-
194
-
195
-
196
-
197
-
198
-
199
-
200
-
201
-
202
-
203
-
204
-
205
-
206
-
207
-
208
-
209
-
210
-
211
-
212
-
213
-
214
-
215
-
216
-
217
-
218
-
219
-
220
-
221
-
222
-
223
-
224
-
225
-
226
-
227
-
228
-
229
-
230
-
231
-
232
-
233
-
234
-
235
-
236
-
237
-
238
-
239
-
240
-
241
-
242
-
243
-
244
-
245
-
246
-
247
-
248
-
249
-
250
-
251
-
252
-
253
-
254
-
255
-
256
-
257
-
258
-
259
-
260
-
261
-
262
-
263
-
264
-
265
-
266
-
267
-
268
-
269
-
270
-
271
-
272
-
273
-
274
-
275
-
276
-
277
-
278
-
279
-
280
-
281
-
282
-
283
-
284
-
285
-
286
-
287
-
288
 |
 |

68 2015 | ANNUAL REPORT
Operating Results
At December 31, 2015, undrawn committed credit lines totaling €3.4 billion included the first tranche of €2.5 billion
tranche of the new €5.0 billion RCF and approximately €0.9 billion of other revolving credit facilities. At December 31,
2014 and December 31, 2013, undrawn committed credit lines included the €2.1 billion syndicated revolving credit
facility entered into by FCA in 2013 and the U.S.$1.3 billion FCA US RCF.
At December 31, 2015, other committed facilities not reflected within total available liquidity include the undisbursed
€0.4 billion Mexico Bank Loan (defined in Capital Market - Bank Debt - Other below), which is for working capital and
general corporate purposes, and the €0.3 billion of undrawn committed credit lines available to the operating entities
of the Group for the funding of scheduled investments.
The €1.7 billion decrease in total available liquidity from December31, 2014 to December31, 2015 primarily reflects
the reduction in total indebtedness, which was partially offset by cash generated by operations, net of investing
activities, net proceeds from the Ferrari IPO, favorable translation effects of €0.7 billion and an increase in available
undrawn committed credit lines for €0.2 billion. Refer to the section —Cash Flows below for additional information.
Cash Flows
Year Ended December 31, 2015 compared to Years Ended December 31, 2014 and 2013
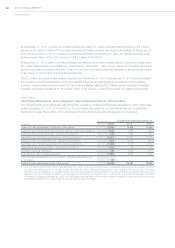
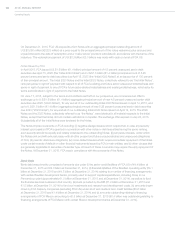
The following table summarizes the cash flows from operating, investing and financing activities for each of the years
ended December 31, 2015, 2014 and 2013. For a complete discussion of our cash flows, see our Consolidated
Statement of Cash Flows within our Consolidated Financial Statements included elsewhere in this report.
For the Years Ended December 31,
(€ million) 2015(1) 2014(1) 2013(1)
Cash and cash equivalents at beginning of the period 22,840 19,455 17,666
Cash flows from operating activities during the year from continuing operations 9,224 7,346 7,084
Cash flows from operating activities - discontinued operations 527 823 534
Cash flows used in investing activities from continuing operations (8,874) (7,608) (7,753)
Cash flows used in investing activities - discontinued operations (426) (532) (301)
Cash flows used in financing activities from continuing operations (5,195) 2,101 3,123
Cash flows from financing activities - discontinued operations 2,067 36 13
Translation exchange differences 681 1,219 (911)
Total change in cash and cash equivalents (1,996) 3,385 1,789
Cash and cash equivalents at end of the period - included within Assets held
for distribution 182 — —
Cash and cash equivalents at end of the period 20,662 22,840 19,455
(1) The cash flows of FCA for the years ended December 31, 2015, 2014, and 2013 have been re-presented following the classification of Ferrari
as a discontinued operation for the year ended December 31, 2015; Ferrari operating results were excluded from the Group’s continuing
operations and are presented as a single line item within the Consolidated Income Statements for each of the years presented. The assets and
liabilities of Ferrari have been classified as Assets held for distribution and Liabilities held for distribution within the Consolidated Statement
of Financial Position at December 31, 2015, while the assets and liabilities of Ferrari have not been classified as such within the comparative
Consolidated Statement of Financial Position for any of the periods presented.