Chrysler 2015 Annual Report Download - page 64
Download and view the complete annual report
Please find page 64 of the 2015 Chrysler annual report below. You can navigate through the pages in the report by either clicking on the pages listed below, or by using the keyword search tool below to find specific information within the annual report.-
 1
1 -
2
-
3
-
4
-
5
-
6
-
7
-
8
-
9
-
10
-
11
-
12
-
13
-
14
-
15
-
16
-
17
-
18
-
19
-
20
-
21
-
22
-
23
-
24
-
25
-
26
-
27
-
28
-
29
-
30
-
31
-
32
-
33
-
34
-
35
-
36
-
37
-
38
-
39
-
40
-
41
-
42
-
43
-
44
-
45
-
46
-
47
-
48
-
49
-
50
-
51
-
52
-
53
-
 54
54 -
 55
55 -
 56
56 -
 57
57 -
 58
58 -
 59
59 -
 60
60 -
 61
61 -
 62
62 -
 63
63 -
 64
64 -
 65
65 -
 66
66 -
 67
67 -
 68
68 -
 69
69 -
 70
70 -
 71
71 -
 72
72 -
 73
73 -
 74
74 -
75
-
76
-
77
-
78
-
79
-
80
-
81
-
82
-
83
-
84
-
85
-
86
-
87
-
88
-
89
-
90
-
91
-
92
-
93
-
94
-
95
-
96
-
97
-
98
-
99
-
100
-
101
-
102
-
103
-
104
-
105
-
106
-
107
-
108
-
109
-
110
-
111
-
112
-
113
-
114
-
115
-
116
-
117
-
118
-
119
-
120
-
121
-
122
-
123
-
124
-
125
-
126
-
127
-
128
-
129
-
130
-
131
-
132
-
133
-
134
-
135
-
136
-
137
-
138
-
139
-
140
-
141
-
142
-
143
-
144
-
145
-
146
-
147
-
148
-
149
-
150
-
151
-
152
-
153
-
154
-
155
-
156
-
157
-
158
-
159
-
160
-
161
-
162
-
163
-
164
-
165
-
166
-
167
-
168
-
169
-
170
-
171
-
172
-
173
-
174
-
175
-
176
-
177
-
178
-
179
-
180
-
181
-
182
-
183
-
184
-
185
-
186
-
187
-
188
-
189
-
190
-
191
-
192
-
193
-
194
-
195
-
196
-
197
-
198
-
199
-
200
-
201
-
202
-
203
-
204
-
205
-
206
-
207
-
208
-
209
-
210
-
211
-
212
-
213
-
214
-
215
-
216
-
217
-
218
-
219
-
220
-
221
-
222
-
223
-
224
-
225
-
226
-
227
-
228
-
229
-
230
-
231
-
232
-
233
-
234
-
235
-
236
-
237
-
238
-
239
-
240
-
241
-
242
-
243
-
244
-
245
-
246
-
247
-
248
-
249
-
250
-
251
-
252
-
253
-
254
-
255
-
256
-
257
-
258
-
259
-
260
-
261
-
262
-
263
-
264
-
265
-
266
-
267
-
268
-
269
-
270
-
271
-
272
-
273
-
274
-
275
-
276
-
277
-
278
-
279
-
280
-
281
-
282
-
283
-
284
-
285
-
286
-
287
-
288
 |
 |

64 2015 | ANNUAL REPORT
Operating Results
Adjusted EBIT
2015 compared to 2014
The decrease in Maserati Adjusted EBIT in 2015 compared to 2014 was due to lower volumes as described above,
unfavorable mix and an increase in industrial costs related to start-up costs for the all-new Levante, which is expected
to be launched in 2016.
2014 compared to 2013
The increase in Maserati Adjusted EBIT in 2014 compared to 2013 was primarily driven by the increase in shipments.
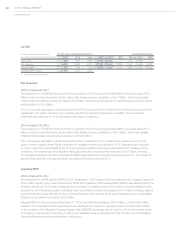
Components
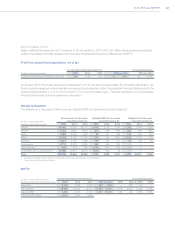
For the Years Ended December 31, Increase/(decrease)
(€ million, except percentages) 2015 2014 2013 2015 vs. 2014 CER 2014 vs. 2013 CER
Magneti Marelli
Net revenues 7,262 6,500 5,988 762 11.7% 10.8% 512 8.6% 10.9%
Adjusted EBIT 321 229 169 92 40.2% 30.1% 60 35.5% 36.7%
Adjusted EBIT margin 4.4% 3.5% 2.8%
Comau
Net revenues 1,952 1,550 1,463 402 25.9% 19.1% 87 5.9% 10.0%
Adjusted EBIT 72 60 49 12 20.0% 18.6% 11 22.4% 24.5%
Adjusted EBIT margin 3.7% 3.9% 3.3%
Teksid
Net revenues 631 639 688 (8) (1.3)% (2.5)% (49) (7.1)% (5.2)%
Adjusted EBIT 2(4) (10) 6 n.m.(1) n.m.(1) 6 n.m.(1) n.m.(1)
Adjusted EBIT margin 0.3% (0.6)% (1.5)%
Intrasegment eliminations
Net revenues (75) (70) (59)
Components
Net revenues 9,770 8,619 8,080 1,151 13.4% 11.3% 539 6.7% 9.3%
Adjusted EBIT 395 285 208 110 38.6% 28.0% 77 37.0% 37.5%
Adjusted EBIT margin 4.0% 3.3% 2.6%
(1) Number is not meaningful.
Net revenues
2015 compared to 2014
Magneti Marelli
The increase in Magneti Marelli Net revenues in 2015 compared to 2014 primarily reflected positive performance in the
lighting and electronic systems businesses.
Comau
The increase in Comau Net revenues in 2015 compared to 2014 was mainly attributable to the body assembly,
powertrain and robotics businesses.
Teksid
The decrease in Teksid Net revenues in 2015 compared to 2014 was primarily attributable to a 10 percent decrease in
cast iron business volumes, which was partially offset by a 21 percent increase in aluminum business volumes.