Chrysler 2015 Annual Report Download - page 51
Download and view the complete annual report
Please find page 51 of the 2015 Chrysler annual report below. You can navigate through the pages in the report by either clicking on the pages listed below, or by using the keyword search tool below to find specific information within the annual report.-
 1
1 -
2
-
3
-
4
-
5
-
6
-
7
-
8
-
9
-
10
-
11
-
12
-
13
-
14
-
15
-
16
-
17
-
18
-
19
-
20
-
21
-
22
-
23
-
24
-
25
-
26
-
27
-
28
-
29
-
30
-
31
-
32
-
33
-
34
-
35
-
36
-
37
-
38
-
39
-
40
-
 41
41 -
 42
42 -
 43
43 -
 44
44 -
 45
45 -
 46
46 -
 47
47 -
 48
48 -
 49
49 -
 50
50 -
 51
51 -
 52
52 -
 53
53 -
 54
54 -
 55
55 -
 56
56 -
 57
57 -
 58
58 -
 59
59 -
 60
60 -
 61
61 -
62
-
63
-
64
-
65
-
66
-
67
-
68
-
69
-
70
-
71
-
72
-
73
-
74
-
75
-
76
-
77
-
78
-
79
-
80
-
81
-
82
-
83
-
84
-
85
-
86
-
87
-
88
-
89
-
90
-
91
-
92
-
93
-
94
-
95
-
96
-
97
-
98
-
99
-
100
-
101
-
102
-
103
-
104
-
105
-
106
-
107
-
108
-
109
-
110
-
111
-
112
-
113
-
114
-
115
-
116
-
117
-
118
-
119
-
120
-
121
-
122
-
123
-
124
-
125
-
126
-
127
-
128
-
129
-
130
-
131
-
132
-
133
-
134
-
135
-
136
-
137
-
138
-
139
-
140
-
141
-
142
-
143
-
144
-
145
-
146
-
147
-
148
-
149
-
150
-
151
-
152
-
153
-
154
-
155
-
156
-
157
-
158
-
159
-
160
-
161
-
162
-
163
-
164
-
165
-
166
-
167
-
168
-
169
-
170
-
171
-
172
-
173
-
174
-
175
-
176
-
177
-
178
-
179
-
180
-
181
-
182
-
183
-
184
-
185
-
186
-
187
-
188
-
189
-
190
-
191
-
192
-
193
-
194
-
195
-
196
-
197
-
198
-
199
-
200
-
201
-
202
-
203
-
204
-
205
-
206
-
207
-
208
-
209
-
210
-
211
-
212
-
213
-
214
-
215
-
216
-
217
-
218
-
219
-
220
-
221
-
222
-
223
-
224
-
225
-
226
-
227
-
228
-
229
-
230
-
231
-
232
-
233
-
234
-
235
-
236
-
237
-
238
-
239
-
240
-
241
-
242
-
243
-
244
-
245
-
246
-
247
-
248
-
249
-
250
-
251
-
252
-
253
-
254
-
255
-
256
-
257
-
258
-
259
-
260
-
261
-
262
-
263
-
264
-
265
-
266
-
267
-
268
-
269
-
270
-
271
-
272
-
273
-
274
-
275
-
276
-
277
-
278
-
279
-
280
-
281
-
282
-
283
-
284
-
285
-
286
-
287
-
288
 |
 |

2015 | ANNUAL REPORT 51
Adjusted EBIT
Adjusted EBIT is calculated as EBIT excluding: gains/(losses) on the disposal of investments, restructuring,
impairments, asset write-offs and other unusual income/(expenses) that are considered rare or discrete events that
are infrequent in nature. Adjusted EBIT is used for internal reporting to assess performance and as part of the Group’s
forecasting, budgeting and decision making processes as it provides additional transparency of the Group’s core
operations. We believe this measure allows management to view operating trends, perform analytical comparisons
and benchmark performance between periods and among our segments. We also believe that Adjusted EBIT
provides useful information to investors as it is a common performance measure to compare results or estimate
valuations across companies in our industry. Refer to the section —Results of Operations below for further discussion
and refer to Note 29 within the Consolidated Financial Statements included elsewhere in this report for a reconciliation
of Adjusted EBIT to EBIT, which is the most directly comparable measure included in our Consolidated Income
Statement. Adjusted EBIT should not be considered as a substitute for net profit/(loss), cash flow or other methods of
analyzing our results as reported under EU-IFRS.
Constant Currency Information
The discussion within —Results of Operations includes information about our results at constant exchange rates
(“CER”), which is calculated by applying the prior-year average exchange rates to current financial data expressed in
local currency in which the relevant financial statements are denominated (see —Significant Accounting Policies in the
Consolidated Financial Statements included elsewhere in this report for information on the exchange rates applied).
Although we do not believe that this non-GAAP measure is a substitute for GAAP measures, we do believe that such
results excluding the impact of currency fluctuations year-on-year, provide additional useful information to investors
regarding the operating performance and trends in our business on a local currency basis.
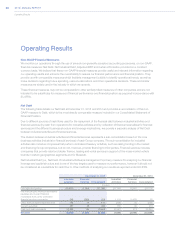
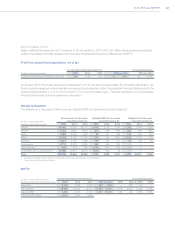
Results of Operations
Consolidated Results of Operations – 2015 compared to 2014 and 2014 compared to 2013
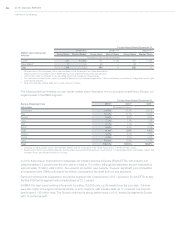
The following is a discussion of the results of operations for the year ended December31, 2015 as compared to
the year ended December31, 2014 and for the year ended December31, 2014 as compared to the year ended
December31, 2013. The discussion of certain line items (Cost of sales, Selling, general and administrative costs and
Research and development costs) includes a presentation of such line items as a percentage of Net revenues for the
respective periods presented as well as constant exchange rates, to facilitate year-on-year comparisons.
For the Years Ended December 31,
(€ million) 2015 2014 2013
Net revenues 110,595 93,640 84,530
Cost of sales 97,620 81,592 73,038
Selling, general and administrative costs 7,728 6,947 6,615
Research and development costs 2,864 2,334 2,275
Result from investments 143 131 84
Gains on disposal of investments —12 8
Restructuring costs 53 50 28
Other income/(expenses) 152 (26) (28)
EBIT 2,625 2,834 2,638
Net financial expenses 2,366 2,051 1,989
Profit before taxes 259 783 649
Tax expense/(income) 166 424 (1,059)
Net profit from continuing operations 93 359 1,708
Profit from discontinued operations, net of tax 284 273 243
Net profit 377 632 1,951
Net profit attributable to:
Owners of the parent 334 568 904
Non-controlling interests 43 64 1,047