Chrysler 2013 Annual Report Download - page 85
Download and view the complete annual report
Please find page 85 of the 2013 Chrysler annual report below. You can navigate through the pages in the report by either clicking on the pages listed below, or by using the keyword search tool below to find specific information within the annual report.-
 1
1 -
2
-
3
-
4
-
5
-
6
-
7
-
8
-
9
-
10
-
11
-
12
-
13
-
14
-
15
-
16
-
17
-
18
-
19
-
20
-
21
-
22
-
23
-
24
-
25
-
26
-
27
-
28
-
29
-
30
-
31
-
32
-
33
-
34
-
35
-
36
-
37
-
38
-
39
-
40
-
41
-
42
-
43
-
44
-
45
-
46
-
47
-
48
-
49
-
50
-
51
-
52
-
53
-
54
-
55
-
56
-
57
-
58
-
59
-
60
-
61
-
62
-
63
-
64
-
65
-
66
-
67
-
68
-
69
-
70
-
71
-
72
-
73
-
74
-
 75
75 -
 76
76 -
 77
77 -
 78
78 -
 79
79 -
 80
80 -
 81
81 -
 82
82 -
 83
83 -
 84
84 -
 85
85 -
 86
86 -
 87
87 -
 88
88 -
 89
89 -
 90
90 -
 91
91 -
 92
92 -
 93
93 -
 94
94 -
 95
95 -
96
-
97
-
98
-
99
-
100
-
101
-
102
-
103
-
104
-
105
-
106
-
107
-
108
-
109
-
110
-
111
-
112
-
113
-
114
-
115
-
116
-
117
-
118
-
119
-
120
-
121
-
122
-
123
-
124
-
125
-
126
-
127
-
128
-
129
-
130
-
131
-
132
-
133
-
134
-
135
-
136
-
137
-
138
-
139
-
140
-
141
-
142
-
143
-
144
-
145
-
146
-
147
-
148
-
149
-
150
-
151
-
152
-
153
-
154
-
155
-
156
-
157
-
158
-
159
-
160
-
161
-
162
-
163
-
164
-
165
-
166
-
167
-
168
-
169
-
170
-
171
-
172
-
173
-
174
-
175
-
176
-
177
-
178
-
179
-
180
-
181
-
182
-
183
-
184
-
185
-
186
-
187
-
188
-
189
-
190
-
191
-
192
-
193
-
194
-
195
-
196
-
197
-
198
-
199
-
200
-
201
-
202
-
203
-
204
-
205
-
206
-
207
-
208
-
209
-
210
-
211
-
212
-
213
-
214
-
215
-
216
-
217
-
218
-
219
-
220
-
221
-
222
-
223
-
224
-
225
-
226
-
227
-
228
-
229
-
230
-
231
-
232
-
233
-
234
-
235
-
236
-
237
-
238
-
239
-
240
-
241
-
242
-
243
-
244
-
245
-
246
-
247
-
248
-
249
-
250
-
251
-
252
-
253
-
254
-
255
-
256
-
257
-
258
-
259
-
260
-
261
-
262
-
263
-
264
-
265
-
266
-
267
-
268
-
269
-
270
-
271
-
272
-
273
-
274
-
275
-
276
-
277
-
278
-
279
-
280
-
281
-
282
-
283
-
284
-
285
-
286
-
287
-
288
-
289
-
290
-
291
-
292
-
293
-
294
-
295
-
296
-
297
-
298
-
299
-
300
-
301
-
302
-
303
-
304
-
305
-
306
-
307
-
308
-
309
-
310
-
311
-
312
-
313
-
314
-
315
-
316
-
317
-
318
-
319
-
320
-
321
-
322
-
323
-
324
-
325
-
326
-
327
-
328
-
329
-
330
-
331
-
332
-
333
-
334
-
335
-
336
-
337
-
338
-
339
-
340
-
341
-
342
-
343
-
344
-
345
-
346
-
347
-
348
-
349
-
350
-
351
-
352
-
353
-
354
-
355
-
356
-
357
-
358
-
359
-
360
-
361
-
362
-
363
-
364
-
365
-
366
 |
 |

84 Report on Operations
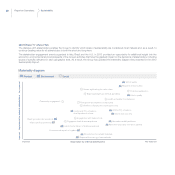
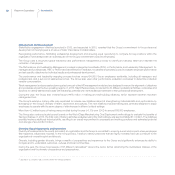
Dedication to innovation in numbers (no.) 2013
CFR employees at year end 905
Co-funded research programs, approved under the EU’s 7th Framework Program(*)(2007-2013) 174
of which: approved in 2013 23
(*) The Framework Programs are funding instruments established by the European Union to support and encourage research and development. Each program is put forward
by the European Commission and adopted by the European Council and Parliament. The 7th Framework Program ran from 2007 to 2013.
Strategy to Minimize Emissions
The Group’s product strategy is based on an approach centered on reducing the environmental impact of vehicles over their entire life
cycle. Key elements in that strategy include improving the efficiency of conventional engines, offering a full range of alternative fuel vehicles,
developing alternative propulsion and emissions reduction systems, reducing the energy requirements of vehicles, promoting driver behavior
that contributes to reducing emissions and introducing new mobility services and solutions.
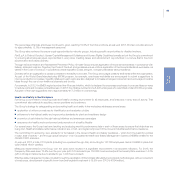
There is no single solution to the challenges faced by the automotive industry. Immediate and tangible results can only be achieved by
combining conventional and alternative technologies, while recognizing and accommodating the different economic, geographic and fuel
requirements of each market. Affordability is also a key consideration: even the most effective technologies cannot have a significant impact
on the environment if they are too expensive to reach a sufficiently large number of people.
The Group’s commitment to increasingly sustainable mobility has been demonstrated by the results already achieved in reducing fuel
consumption and CO2 emissions, particularly in EMEA and NAFTA, where approximately 72% of Group revenues were generated in 2013.
In the European Union, the Group’s mass-market and premium brands (Fiat, Alfa Romeo, Lancia, Abarth, Chrysler and Jeep) have reduced
average CO2 emissions per vehicle sold by 24% over the past 13 years. In addition, approximately 71% of Group cars sold in 2013 had CO2
emissions at or below 120 g/km, and 81% at or below 130 g/km.
New registrations by CO2 emissions level in European Union for Mass-Market and premium brands (g/km)(*)
up to 100 13%
from 101 to 110 12%
from 111 to 120 46%
from 121 to 130 10%
above 130 19%
(*) CO2 data based on New European Driving Cycle (NEDC) measurement standard.
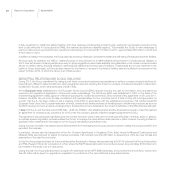
In the United States, which accounts for 84% of shipments in the NAFTA market, vehicle efficiency is measured by fuel economy(1) expressed
in miles per gallon (mpg). In 2013, Chrysler Group’s domestic passenger car mpg increased from 31.1 in 2012 to 32.1, an improvement of 3%.
Light truck mpg increased 1%, from 24.3 to 24.5.
This trend of continuing improvements in emissions and fuel economy is the result of strategic choices made by the Group based on a process
of continuous innovation.
Following are descriptions of some of the main technological innovations introduced on Group vehicles during 2013.
(1) Data is reported to the U.S. National Highway Traffic Safety Administration (NHTSA) and provided by model year, meaning the year used to designate a discrete vehicle
model, irrespective of the calendar year in which the vehicle was actually produced, provided that the production period does not exceed 24 months. CAFE standards from
NHTSA are set independently for passenger cars and light duty trucks. Fuel economy is based on the most recent NHTSA required submission, which for 2013 reflects
mid-model year data. Previous year data is adjusted to reflect final EPA/NHTSA reports.
Sustainability