Chrysler 2013 Annual Report Download - page 200
Download and view the complete annual report
Please find page 200 of the 2013 Chrysler annual report below. You can navigate through the pages in the report by either clicking on the pages listed below, or by using the keyword search tool below to find specific information within the annual report.-
 1
1 -
2
-
3
-
4
-
5
-
6
-
7
-
8
-
9
-
10
-
11
-
12
-
13
-
14
-
15
-
16
-
17
-
18
-
19
-
20
-
21
-
22
-
23
-
24
-
25
-
26
-
27
-
28
-
29
-
30
-
31
-
32
-
33
-
34
-
35
-
36
-
37
-
38
-
39
-
40
-
41
-
42
-
43
-
44
-
45
-
46
-
47
-
48
-
49
-
50
-
51
-
52
-
53
-
54
-
55
-
56
-
57
-
58
-
59
-
60
-
61
-
62
-
63
-
64
-
65
-
66
-
67
-
68
-
69
-
70
-
71
-
72
-
73
-
74
-
75
-
76
-
77
-
78
-
79
-
80
-
81
-
82
-
83
-
84
-
85
-
86
-
87
-
88
-
89
-
90
-
91
-
92
-
93
-
94
-
95
-
96
-
97
-
98
-
99
-
100
-
101
-
102
-
103
-
104
-
105
-
106
-
107
-
108
-
109
-
110
-
111
-
112
-
113
-
114
-
115
-
116
-
117
-
118
-
119
-
120
-
121
-
122
-
123
-
124
-
125
-
126
-
127
-
128
-
129
-
130
-
131
-
132
-
133
-
134
-
135
-
136
-
137
-
138
-
139
-
140
-
141
-
142
-
143
-
144
-
145
-
146
-
147
-
148
-
149
-
150
-
151
-
152
-
153
-
154
-
155
-
156
-
157
-
158
-
159
-
160
-
161
-
162
-
163
-
164
-
165
-
166
-
167
-
168
-
169
-
170
-
171
-
172
-
173
-
174
-
175
-
176
-
177
-
178
-
179
-
180
-
181
-
182
-
183
-
184
-
185
-
186
-
187
-
188
-
189
-
 190
190 -
 191
191 -
 192
192 -
 193
193 -
 194
194 -
 195
195 -
 196
196 -
 197
197 -
 198
198 -
 199
199 -
 200
200 -
 201
201 -
 202
202 -
 203
203 -
 204
204 -
 205
205 -
 206
206 -
 207
207 -
 208
208 -
 209
209 -
 210
210 -
211
-
212
-
213
-
214
-
215
-
216
-
217
-
218
-
219
-
220
-
221
-
222
-
223
-
224
-
225
-
226
-
227
-
228
-
229
-
230
-
231
-
232
-
233
-
234
-
235
-
236
-
237
-
238
-
239
-
240
-
241
-
242
-
243
-
244
-
245
-
246
-
247
-
248
-
249
-
250
-
251
-
252
-
253
-
254
-
255
-
256
-
257
-
258
-
259
-
260
-
261
-
262
-
263
-
264
-
265
-
266
-
267
-
268
-
269
-
270
-
271
-
272
-
273
-
274
-
275
-
276
-
277
-
278
-
279
-
280
-
281
-
282
-
283
-
284
-
285
-
286
-
287
-
288
-
289
-
290
-
291
-
292
-
293
-
294
-
295
-
296
-
297
-
298
-
299
-
300
-
301
-
302
-
303
-
304
-
305
-
306
-
307
-
308
-
309
-
310
-
311
-
312
-
313
-
314
-
315
-
316
-
317
-
318
-
319
-
320
-
321
-
322
-
323
-
324
-
325
-
326
-
327
-
328
-
329
-
330
-
331
-
332
-
333
-
334
-
335
-
336
-
337
-
338
-
339
-
340
-
341
-
342
-
343
-
344
-
345
-
346
-
347
-
348
-
349
-
350
-
351
-
352
-
353
-
354
-
355
-
356
-
357
-
358
-
359
-
360
-
361
-
362
-
363
-
364
-
365
-
366
 |
 |
199
Consolidated
Financial Statements
at 31 December 2013
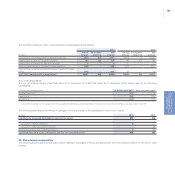
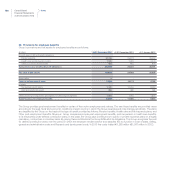
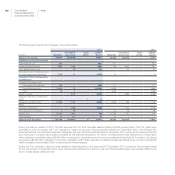
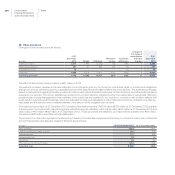
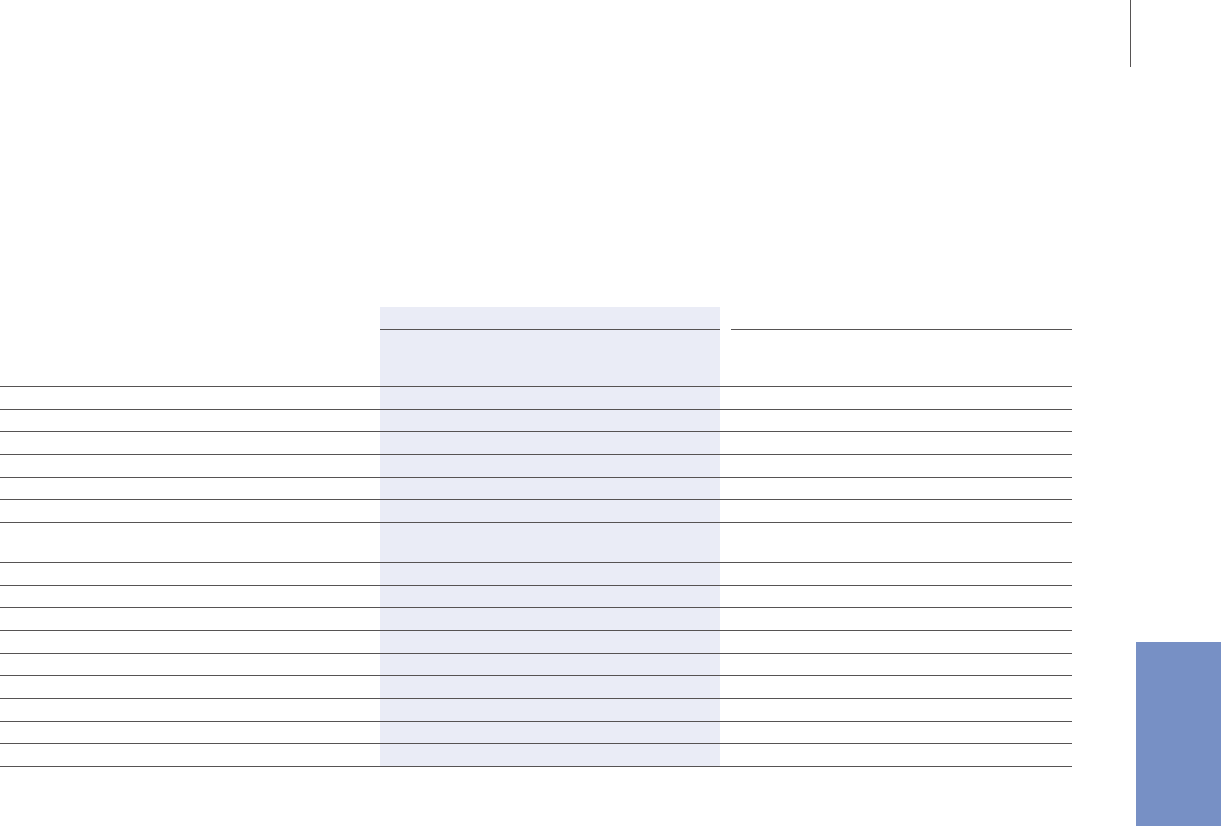
The fair value of plan assets by class is as follows:
At 31 December 2013 At 31 December 2012
(€ million) Amount
of which have a
quoted market price in
an active market Amount
of which have a
quoted market price in
an active market
Cash and cash equivalent 532 401 516 403
US equity securities 2,047 2,033 1,882 1,787
Non-US equity securities 1,540 1,531 1,558 1,549
Commingled funds 1,518 195 967 69
Equity instruments 5,105 3,759 4,407 3,405
Government securities 2,545 729 3,632 1,708
Corporate bonds (including Convertible
and high yield bonds) 5,049 38 5,271 11
Other fixed income 635 - 717 1
Fixed income securities 8,229 767 9,620 1,719
Private equity funds 1,713 - 1,861 -
Mutual funds 4 - 3 3
Real estate funds 1,222 - 1,221 -
Hedge funds 1,759 - 1,844 -
Investments funds 4,698 - 4,929 3
Insurance contracts and other 418 46 577 7
Total fair value of plan assets 18,982 4,974 20,049 5,537
Non-US Equity securities are invested broadly in developed international and emerging markets. Debt instruments are fixed income securities
which comprise primarily long duration U.S. Treasury and global government bonds, as well as U.S. developed international and emerging
market companies’ debt securities diversified by sector, geography and through a wide range of market capitalization. Private equity funds
include those in limited partnerships that invest primarily in operating companies that are not publicly traded on a stock exchange. Real estate
investments includes those in limited partnerships that invest in various commercial and residential real estate projects both domestically and
internationally. Hedge fund investments include those seeking to maximize absolute return using a broad range of strategies to enhance returns
and provide additional diversification.
The investment strategies and objectives for pension assets in the U.S., Canada and Mexico reflect a balance of liability-hedging and return-
seeking investment considerations. The investment objectives are to minimize the volatility of the value of the pension assets relative to the
pension liabilities and to ensure assets are sufficient to pay plan obligations. The objective of minimizing the volatility of assets relative to
liabilities is addressed primarily through asset diversification, partial asset−liability matching and hedging. Assets are broadly diversified across
many asset classes to achieve risk−adjusted returns that, in total, lower asset volatility relative to the liabilities. Additionally, in order to minimize
pension asset volatility relative to the pension liabilities, a portion of the pension plan assets are allocated to fixed income securities. The group
policy, for these plans, rebalances investments regularly and ensures actual allocations are in line with target allocations as appropriate.