Chrysler 2013 Annual Report Download - page 124
Download and view the complete annual report
Please find page 124 of the 2013 Chrysler annual report below. You can navigate through the pages in the report by either clicking on the pages listed below, or by using the keyword search tool below to find specific information within the annual report.-
 1
1 -
2
-
3
-
4
-
5
-
6
-
7
-
8
-
9
-
10
-
11
-
12
-
13
-
14
-
15
-
16
-
17
-
18
-
19
-
20
-
21
-
22
-
23
-
24
-
25
-
26
-
27
-
28
-
29
-
30
-
31
-
32
-
33
-
34
-
35
-
36
-
37
-
38
-
39
-
40
-
41
-
42
-
43
-
44
-
45
-
46
-
47
-
48
-
49
-
50
-
51
-
52
-
53
-
54
-
55
-
56
-
57
-
58
-
59
-
60
-
61
-
62
-
63
-
64
-
65
-
66
-
67
-
68
-
69
-
70
-
71
-
72
-
73
-
74
-
75
-
76
-
77
-
78
-
79
-
80
-
81
-
82
-
83
-
84
-
85
-
86
-
87
-
88
-
89
-
90
-
91
-
92
-
93
-
94
-
95
-
96
-
97
-
98
-
99
-
100
-
101
-
102
-
103
-
104
-
105
-
106
-
107
-
108
-
109
-
110
-
111
-
112
-
113
-
 114
114 -
 115
115 -
 116
116 -
 117
117 -
 118
118 -
 119
119 -
 120
120 -
 121
121 -
 122
122 -
 123
123 -
 124
124 -
 125
125 -
 126
126 -
 127
127 -
 128
128 -
 129
129 -
 130
130 -
 131
131 -
 132
132 -
 133
133 -
 134
134 -
135
-
136
-
137
-
138
-
139
-
140
-
141
-
142
-
143
-
144
-
145
-
146
-
147
-
148
-
149
-
150
-
151
-
152
-
153
-
154
-
155
-
156
-
157
-
158
-
159
-
160
-
161
-
162
-
163
-
164
-
165
-
166
-
167
-
168
-
169
-
170
-
171
-
172
-
173
-
174
-
175
-
176
-
177
-
178
-
179
-
180
-
181
-
182
-
183
-
184
-
185
-
186
-
187
-
188
-
189
-
190
-
191
-
192
-
193
-
194
-
195
-
196
-
197
-
198
-
199
-
200
-
201
-
202
-
203
-
204
-
205
-
206
-
207
-
208
-
209
-
210
-
211
-
212
-
213
-
214
-
215
-
216
-
217
-
218
-
219
-
220
-
221
-
222
-
223
-
224
-
225
-
226
-
227
-
228
-
229
-
230
-
231
-
232
-
233
-
234
-
235
-
236
-
237
-
238
-
239
-
240
-
241
-
242
-
243
-
244
-
245
-
246
-
247
-
248
-
249
-
250
-
251
-
252
-
253
-
254
-
255
-
256
-
257
-
258
-
259
-
260
-
261
-
262
-
263
-
264
-
265
-
266
-
267
-
268
-
269
-
270
-
271
-
272
-
273
-
274
-
275
-
276
-
277
-
278
-
279
-
280
-
281
-
282
-
283
-
284
-
285
-
286
-
287
-
288
-
289
-
290
-
291
-
292
-
293
-
294
-
295
-
296
-
297
-
298
-
299
-
300
-
301
-
302
-
303
-
304
-
305
-
306
-
307
-
308
-
309
-
310
-
311
-
312
-
313
-
314
-
315
-
316
-
317
-
318
-
319
-
320
-
321
-
322
-
323
-
324
-
325
-
326
-
327
-
328
-
329
-
330
-
331
-
332
-
333
-
334
-
335
-
336
-
337
-
338
-
339
-
340
-
341
-
342
-
343
-
344
-
345
-
346
-
347
-
348
-
349
-
350
-
351
-
352
-
353
-
354
-
355
-
356
-
357
-
358
-
359
-
360
-
361
-
362
-
363
-
364
-
365
-
366
 |
 |

123
Consolidated
Financial Statements
at 31 December 2013
Consolidated
Financial Statements
at 31 December 2013
Consolidated Statement
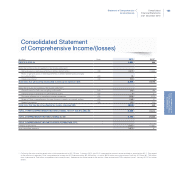
of Comprehensive Income/(losses)
Statement of Comprehensive
Income/(losses)
(€ million) Note 2013 2012(*)
PROFIT/(LOSS) (A) 1,951 896
Items that will never be reclassified to the Income statement:
Gains/(losses) on remeasurements of defined benefit plans (23) 2,678 (1,843)
Share of gains/(losses) on remeasurements of defined benefit plans for equity
accounted entities (23) (9) 1
Related tax impact (23) 239 3
Total items that will never be reclassified to the Income statement (B1) 2,908 (1,839)
Items that may be reclassified to the Income statement:
Gains/(losses) on cash flow hedging instruments (23) 162 184
Gains/(losses) on available-for-sale financial assets (23) 427
Exchange differences on translating foreign operations (23) (708) (270)
Share of Other comprehensive Income/(losses) for equity accounted entities (23) (100) 21
Related tax impact (23) (27) (24)
Total items that may be reclassified to the Income statement (B2) (669) (62)
TOTAL OTHER COMPREHENSIVE INCOME/(LOSSES), NET OF TAX (B1)+(B2)=(B) 2,239 (1,901)
TOTAL COMPREHENSIVE INCOME/(LOSSES) (A)+(B) 4,190 (1,005)
TOTAL COMPREHENSIVE INCOME/(LOSSES) ATTRIBUTABLE TO:
Owners of the parent 2,117 (1,062)
Non-controlling interests 2,073 57
(*) Following the retrospective application of the amendment to IAS 19 from 1 January 2013, the 2012 comparative amounts were restated as required by IAS 1. Compared
to the previously reported, Total comprehensive income for 2012 decreased by €2,265 million, of which €515 million arose from lower Profit for 2012 and €1,750 million
from a decrease in Total other comprehensive Income/(losses). Reference should be made to the section “New and revised IFRSs adopted since 1 January 2013” for further
details.