Chrysler 2013 Annual Report Download - page 201
Download and view the complete annual report
Please find page 201 of the 2013 Chrysler annual report below. You can navigate through the pages in the report by either clicking on the pages listed below, or by using the keyword search tool below to find specific information within the annual report.-
 1
1 -
2
-
3
-
4
-
5
-
6
-
7
-
8
-
9
-
10
-
11
-
12
-
13
-
14
-
15
-
16
-
17
-
18
-
19
-
20
-
21
-
22
-
23
-
24
-
25
-
26
-
27
-
28
-
29
-
30
-
31
-
32
-
33
-
34
-
35
-
36
-
37
-
38
-
39
-
40
-
41
-
42
-
43
-
44
-
45
-
46
-
47
-
48
-
49
-
50
-
51
-
52
-
53
-
54
-
55
-
56
-
57
-
58
-
59
-
60
-
61
-
62
-
63
-
64
-
65
-
66
-
67
-
68
-
69
-
70
-
71
-
72
-
73
-
74
-
75
-
76
-
77
-
78
-
79
-
80
-
81
-
82
-
83
-
84
-
85
-
86
-
87
-
88
-
89
-
90
-
91
-
92
-
93
-
94
-
95
-
96
-
97
-
98
-
99
-
100
-
101
-
102
-
103
-
104
-
105
-
106
-
107
-
108
-
109
-
110
-
111
-
112
-
113
-
114
-
115
-
116
-
117
-
118
-
119
-
120
-
121
-
122
-
123
-
124
-
125
-
126
-
127
-
128
-
129
-
130
-
131
-
132
-
133
-
134
-
135
-
136
-
137
-
138
-
139
-
140
-
141
-
142
-
143
-
144
-
145
-
146
-
147
-
148
-
149
-
150
-
151
-
152
-
153
-
154
-
155
-
156
-
157
-
158
-
159
-
160
-
161
-
162
-
163
-
164
-
165
-
166
-
167
-
168
-
169
-
170
-
171
-
172
-
173
-
174
-
175
-
176
-
177
-
178
-
179
-
180
-
181
-
182
-
183
-
184
-
185
-
186
-
187
-
188
-
189
-
190
-
 191
191 -
 192
192 -
 193
193 -
 194
194 -
 195
195 -
 196
196 -
 197
197 -
 198
198 -
 199
199 -
 200
200 -
 201
201 -
 202
202 -
 203
203 -
 204
204 -
 205
205 -
 206
206 -
 207
207 -
 208
208 -
 209
209 -
 210
210 -
 211
211 -
212
-
213
-
214
-
215
-
216
-
217
-
218
-
219
-
220
-
221
-
222
-
223
-
224
-
225
-
226
-
227
-
228
-
229
-
230
-
231
-
232
-
233
-
234
-
235
-
236
-
237
-
238
-
239
-
240
-
241
-
242
-
243
-
244
-
245
-
246
-
247
-
248
-
249
-
250
-
251
-
252
-
253
-
254
-
255
-
256
-
257
-
258
-
259
-
260
-
261
-
262
-
263
-
264
-
265
-
266
-
267
-
268
-
269
-
270
-
271
-
272
-
273
-
274
-
275
-
276
-
277
-
278
-
279
-
280
-
281
-
282
-
283
-
284
-
285
-
286
-
287
-
288
-
289
-
290
-
291
-
292
-
293
-
294
-
295
-
296
-
297
-
298
-
299
-
300
-
301
-
302
-
303
-
304
-
305
-
306
-
307
-
308
-
309
-
310
-
311
-
312
-
313
-
314
-
315
-
316
-
317
-
318
-
319
-
320
-
321
-
322
-
323
-
324
-
325
-
326
-
327
-
328
-
329
-
330
-
331
-
332
-
333
-
334
-
335
-
336
-
337
-
338
-
339
-
340
-
341
-
342
-
343
-
344
-
345
-
346
-
347
-
348
-
349
-
350
-
351
-
352
-
353
-
354
-
355
-
356
-
357
-
358
-
359
-
360
-
361
-
362
-
363
-
364
-
365
-
366
 |
 |

200 Consolidated
Financial Statements
at 31 December 2013
Notes
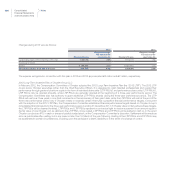
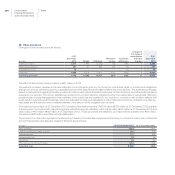
Assets are actively managed, primarily, by external investment managers. Investment managers are not permitted to invest outside of the asset
class or strategy for which they have been appointed. The Group uses investment guidelines to ensure investment managers invest solely
within the mandated investment strategy. Certain investment managers use derivative financial instruments to mitigate the risk of changes in
interest rates and foreign currencies impacting the fair values of certain investments. Derivative financial instruments may also be used in place
of physical securities when it is more cost effective and/or efficient to do so. Plan assets do not include shares of Fiat S.p.A. or properties
occupied by Group companies.
Sources of potential risk in the pension plan assets measurements relate to market risk, interest rate risk and operating risk. Market risk is
mitigated by diversification strategies and as a result, there are no significant concentrations of risk in terms of sector, industry, geography,
market capitalization, or counterparty. Interest rate risk is mitigated by partial asset−liability matching. The fixed income target asset allocation
partially matches the bond−like and long−dated nature of the pension liabilities. Interest rate increases generally will result in a decline in the
fair value of the investments in fixed income securities and the present value of the obligations. Conversely, interest rate decreases generally
will increase the fair value of the investments in fixed income securities and the present value of the obligations.
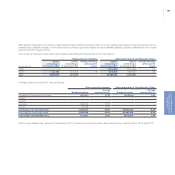
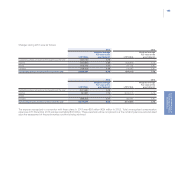
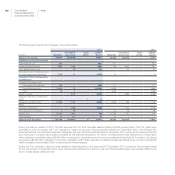
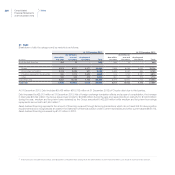
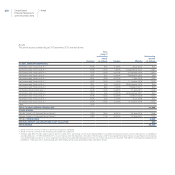
The weighted average assumptions used to determine the defined benefit obligations are as follows:
At 31 December 2013 At 31 December 2012
(In %) USA Canada UK USA Canada UK
Discount rate 4.7 4.6 4.5 4.0 3.9 4.6
Future salary increase rate 3.0 3.5 3.1 3.0 3.5 3.0
The discount rates are used in measuring the obligation and the interest expense/(income) of net period cost. The Group selects these rates
on the basis of the rate on return on high-quality (AA rated) fixed income investments for which the timing and amounts of payments match the
timing and amounts of the projected pension and other post-employment plan. The average duration of the U.S. and Canadian liabilities was
approximately 11 and 12 years, respectively. The average duration of the UK pension liabilities was approximately 21 years.
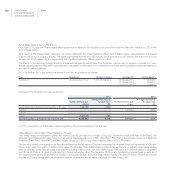
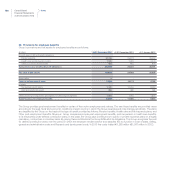
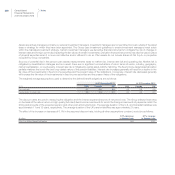
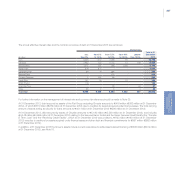
The effect of the increase or decrease of 0.1% in the assumed discount rate, holding all other assumptions constant, would be as follows:
(€ million)
0.1% decrease
in discount rate
0.1% increase
in discount rate
Effect on defined benefit obligation 265 (261)