Chrysler 2013 Annual Report Download - page 175
Download and view the complete annual report
Please find page 175 of the 2013 Chrysler annual report below. You can navigate through the pages in the report by either clicking on the pages listed below, or by using the keyword search tool below to find specific information within the annual report.-
 1
1 -
2
-
3
-
4
-
5
-
6
-
7
-
8
-
9
-
10
-
11
-
12
-
13
-
14
-
15
-
16
-
17
-
18
-
19
-
20
-
21
-
22
-
23
-
24
-
25
-
26
-
27
-
28
-
29
-
30
-
31
-
32
-
33
-
34
-
35
-
36
-
37
-
38
-
39
-
40
-
41
-
42
-
43
-
44
-
45
-
46
-
47
-
48
-
49
-
50
-
51
-
52
-
53
-
54
-
55
-
56
-
57
-
58
-
59
-
60
-
61
-
62
-
63
-
64
-
65
-
66
-
67
-
68
-
69
-
70
-
71
-
72
-
73
-
74
-
75
-
76
-
77
-
78
-
79
-
80
-
81
-
82
-
83
-
84
-
85
-
86
-
87
-
88
-
89
-
90
-
91
-
92
-
93
-
94
-
95
-
96
-
97
-
98
-
99
-
100
-
101
-
102
-
103
-
104
-
105
-
106
-
107
-
108
-
109
-
110
-
111
-
112
-
113
-
114
-
115
-
116
-
117
-
118
-
119
-
120
-
121
-
122
-
123
-
124
-
125
-
126
-
127
-
128
-
129
-
130
-
131
-
132
-
133
-
134
-
135
-
136
-
137
-
138
-
139
-
140
-
141
-
142
-
143
-
144
-
145
-
146
-
147
-
148
-
149
-
150
-
151
-
152
-
153
-
154
-
155
-
156
-
157
-
158
-
159
-
160
-
161
-
162
-
163
-
164
-
 165
165 -
 166
166 -
 167
167 -
 168
168 -
 169
169 -
 170
170 -
 171
171 -
 172
172 -
 173
173 -
 174
174 -
 175
175 -
 176
176 -
 177
177 -
 178
178 -
 179
179 -
 180
180 -
 181
181 -
 182
182 -
 183
183 -
 184
184 -
 185
185 -
186
-
187
-
188
-
189
-
190
-
191
-
192
-
193
-
194
-
195
-
196
-
197
-
198
-
199
-
200
-
201
-
202
-
203
-
204
-
205
-
206
-
207
-
208
-
209
-
210
-
211
-
212
-
213
-
214
-
215
-
216
-
217
-
218
-
219
-
220
-
221
-
222
-
223
-
224
-
225
-
226
-
227
-
228
-
229
-
230
-
231
-
232
-
233
-
234
-
235
-
236
-
237
-
238
-
239
-
240
-
241
-
242
-
243
-
244
-
245
-
246
-
247
-
248
-
249
-
250
-
251
-
252
-
253
-
254
-
255
-
256
-
257
-
258
-
259
-
260
-
261
-
262
-
263
-
264
-
265
-
266
-
267
-
268
-
269
-
270
-
271
-
272
-
273
-
274
-
275
-
276
-
277
-
278
-
279
-
280
-
281
-
282
-
283
-
284
-
285
-
286
-
287
-
288
-
289
-
290
-
291
-
292
-
293
-
294
-
295
-
296
-
297
-
298
-
299
-
300
-
301
-
302
-
303
-
304
-
305
-
306
-
307
-
308
-
309
-
310
-
311
-
312
-
313
-
314
-
315
-
316
-
317
-
318
-
319
-
320
-
321
-
322
-
323
-
324
-
325
-
326
-
327
-
328
-
329
-
330
-
331
-
332
-
333
-
334
-
335
-
336
-
337
-
338
-
339
-
340
-
341
-
342
-
343
-
344
-
345
-
346
-
347
-
348
-
349
-
350
-
351
-
352
-
353
-
354
-
355
-
356
-
357
-
358
-
359
-
360
-
361
-
362
-
363
-
364
-
365
-
366
 |
 |
174 Consolidated
Financial Statements
at 31 December 2013
Notes
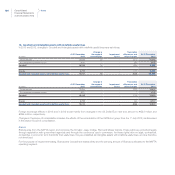
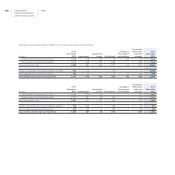
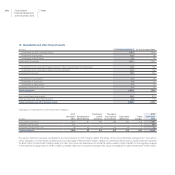
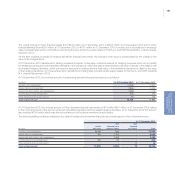
16. Investments and other financial assets
(€ million) At 31 December 2013 At 31 December 2012
Investments in jointly controlled entities 1,405 1,416
Investments in associates 123 58
Investments in subsidiaries 33 33
Equity method investees 1,561 1,507
Investments at fair value with changes directly in Other comprehensive income/(losses) 148 142
Investments at fair value with changes in Income statement 151 153
Investments at fair value 299 295
Investment in subsidiaries 18 18
Investments in associates 19 23
Investments in other entities 15 15
Investments measured at cost 52 56
Total Investments 1,912 1,858
Non-current financial receivables 292 310
Other securities and other financial assets 56 119
Total Investments and other financial assets 2,260 2,287
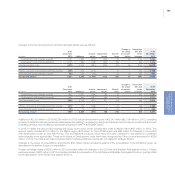
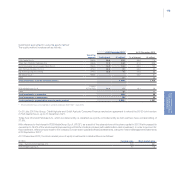
Changes in Investments in 2013 are set out below:
(€ million)
At 31
December
2012
Revaluations/
(Write-downs)
Purchases/
capital
increases
Change in
the scope of
consolidation
Translation
differences
Other
changes
At 31
December
2013
Equity method investees 1,507 87 202 (35) (87) (113) 1,561
Investments at fair value 295 - 1 - - 3 299
Investments measured at cost 56 (5) 9 (5) (4) 1 52
Total Investments 1,858 82 212 (40) (91) (109) 1,912
For equity method investees, revaluations and write-downs in 2013 mainly reflect the share of the net profit/(loss) recognized in the period.
Other changes in investments consisting of a net decrease of €109 million mainly relates to dividends distributed by equity method investees
for €92 million (of which €72 million relate to Tofas-Turk Otomobil Fabrikasi A.S. and €15 million relate to FGA Capital), to the negative change
in the cash flow hedge reserve of €14 million, partially offset by the positive change in fair value of available-for-sale investments of €5 million.