Chrysler 2013 Annual Report Download - page 150
Download and view the complete annual report
Please find page 150 of the 2013 Chrysler annual report below. You can navigate through the pages in the report by either clicking on the pages listed below, or by using the keyword search tool below to find specific information within the annual report.-
 1
1 -
2
-
3
-
4
-
5
-
6
-
7
-
8
-
9
-
10
-
11
-
12
-
13
-
14
-
15
-
16
-
17
-
18
-
19
-
20
-
21
-
22
-
23
-
24
-
25
-
26
-
27
-
28
-
29
-
30
-
31
-
32
-
33
-
34
-
35
-
36
-
37
-
38
-
39
-
40
-
41
-
42
-
43
-
44
-
45
-
46
-
47
-
48
-
49
-
50
-
51
-
52
-
53
-
54
-
55
-
56
-
57
-
58
-
59
-
60
-
61
-
62
-
63
-
64
-
65
-
66
-
67
-
68
-
69
-
70
-
71
-
72
-
73
-
74
-
75
-
76
-
77
-
78
-
79
-
80
-
81
-
82
-
83
-
84
-
85
-
86
-
87
-
88
-
89
-
90
-
91
-
92
-
93
-
94
-
95
-
96
-
97
-
98
-
99
-
100
-
101
-
102
-
103
-
104
-
105
-
106
-
107
-
108
-
109
-
110
-
111
-
112
-
113
-
114
-
115
-
116
-
117
-
118
-
119
-
120
-
121
-
122
-
123
-
124
-
125
-
126
-
127
-
128
-
129
-
130
-
131
-
132
-
133
-
134
-
135
-
136
-
137
-
138
-
139
-
 140
140 -
 141
141 -
 142
142 -
 143
143 -
 144
144 -
 145
145 -
 146
146 -
 147
147 -
 148
148 -
 149
149 -
 150
150 -
 151
151 -
 152
152 -
 153
153 -
 154
154 -
 155
155 -
 156
156 -
 157
157 -
 158
158 -
 159
159 -
 160
160 -
161
-
162
-
163
-
164
-
165
-
166
-
167
-
168
-
169
-
170
-
171
-
172
-
173
-
174
-
175
-
176
-
177
-
178
-
179
-
180
-
181
-
182
-
183
-
184
-
185
-
186
-
187
-
188
-
189
-
190
-
191
-
192
-
193
-
194
-
195
-
196
-
197
-
198
-
199
-
200
-
201
-
202
-
203
-
204
-
205
-
206
-
207
-
208
-
209
-
210
-
211
-
212
-
213
-
214
-
215
-
216
-
217
-
218
-
219
-
220
-
221
-
222
-
223
-
224
-
225
-
226
-
227
-
228
-
229
-
230
-
231
-
232
-
233
-
234
-
235
-
236
-
237
-
238
-
239
-
240
-
241
-
242
-
243
-
244
-
245
-
246
-
247
-
248
-
249
-
250
-
251
-
252
-
253
-
254
-
255
-
256
-
257
-
258
-
259
-
260
-
261
-
262
-
263
-
264
-
265
-
266
-
267
-
268
-
269
-
270
-
271
-
272
-
273
-
274
-
275
-
276
-
277
-
278
-
279
-
280
-
281
-
282
-
283
-
284
-
285
-
286
-
287
-
288
-
289
-
290
-
291
-
292
-
293
-
294
-
295
-
296
-
297
-
298
-
299
-
300
-
301
-
302
-
303
-
304
-
305
-
306
-
307
-
308
-
309
-
310
-
311
-
312
-
313
-
314
-
315
-
316
-
317
-
318
-
319
-
320
-
321
-
322
-
323
-
324
-
325
-
326
-
327
-
328
-
329
-
330
-
331
-
332
-
333
-
334
-
335
-
336
-
337
-
338
-
339
-
340
-
341
-
342
-
343
-
344
-
345
-
346
-
347
-
348
-
349
-
350
-
351
-
352
-
353
-
354
-
355
-
356
-
357
-
358
-
359
-
360
-
361
-
362
-
363
-
364
-
365
-
366
 |
 |

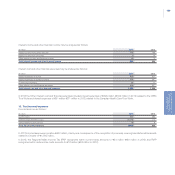
149
Consolidated
Financial Statements
at 31 December 2013
2012
(€ million)
Amounts as
previously reported
IAS 19 revised
adoption
effect
Amounts as
restated
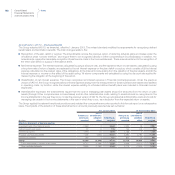
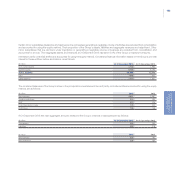
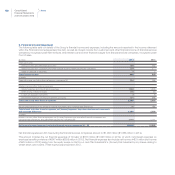
Effects on Income statement
Cost of sales 71,474 227 71,701
Selling, general and administrative costs 6,731 32 6,763
Research and development costs 1,835 15 1,850
Other income/(expenses) (103) 1 (102)
Trading profit/(loss) 3,814 (273) 3,541
EBIT 3,677 (273) 3,404
Financial income/(expenses) (1,641) (244) (1,885)
Income taxes 625 (2) 623
Profit/(loss) from continuing operations 1,411 (515) 896
Profit/(loss) for the period 1,411 (515) 896
Profit/(loss) for the period attributable to:
Owners of the parent 348 (304) 44
Non-controlling interests 1,063 (211) 852
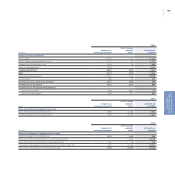
2012
(in €)
Amounts as
previously reported
IAS 19 revised
adoption
effect
Amounts as
restated
Basic and diluted earnings/(loss) per share
Basic earnings/(loss) per ordinary share 0.286 (0.250) 0.036
Diluted earnings/(loss) per ordinary share 0.284 (0.248) 0.036
2012
(€ million)
Amounts as
previously reported
IAS 19 revised
adoption
effect
Amounts as
restated
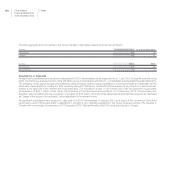
Effects on Statement of comprehensive income
PROFIT/(LOSS) FOR THE PERIOD (A) 1,411 (515) 896
Items that will never be reclassified to Income statement (B1) - (1,839) (1,839)
Items that may be reclassified to Income statement (B2) (151) 89 (62)
Total Other comprehensive income/(losses), net of tax (B1)+(B2)=(B) (151) (1,750) (1,901)
Total Other comprehensive income/(losses) (A)+(B) 1,260 (2,265) (1,005)