Chrysler 2013 Annual Report Download - page 156
Download and view the complete annual report
Please find page 156 of the 2013 Chrysler annual report below. You can navigate through the pages in the report by either clicking on the pages listed below, or by using the keyword search tool below to find specific information within the annual report.-
 1
1 -
2
-
3
-
4
-
5
-
6
-
7
-
8
-
9
-
10
-
11
-
12
-
13
-
14
-
15
-
16
-
17
-
18
-
19
-
20
-
21
-
22
-
23
-
24
-
25
-
26
-
27
-
28
-
29
-
30
-
31
-
32
-
33
-
34
-
35
-
36
-
37
-
38
-
39
-
40
-
41
-
42
-
43
-
44
-
45
-
46
-
47
-
48
-
49
-
50
-
51
-
52
-
53
-
54
-
55
-
56
-
57
-
58
-
59
-
60
-
61
-
62
-
63
-
64
-
65
-
66
-
67
-
68
-
69
-
70
-
71
-
72
-
73
-
74
-
75
-
76
-
77
-
78
-
79
-
80
-
81
-
82
-
83
-
84
-
85
-
86
-
87
-
88
-
89
-
90
-
91
-
92
-
93
-
94
-
95
-
96
-
97
-
98
-
99
-
100
-
101
-
102
-
103
-
104
-
105
-
106
-
107
-
108
-
109
-
110
-
111
-
112
-
113
-
114
-
115
-
116
-
117
-
118
-
119
-
120
-
121
-
122
-
123
-
124
-
125
-
126
-
127
-
128
-
129
-
130
-
131
-
132
-
133
-
134
-
135
-
136
-
137
-
138
-
139
-
140
-
141
-
142
-
143
-
144
-
145
-
 146
146 -
 147
147 -
 148
148 -
 149
149 -
 150
150 -
 151
151 -
 152
152 -
 153
153 -
 154
154 -
 155
155 -
 156
156 -
 157
157 -
 158
158 -
 159
159 -
 160
160 -
 161
161 -
 162
162 -
 163
163 -
 164
164 -
 165
165 -
 166
166 -
167
-
168
-
169
-
170
-
171
-
172
-
173
-
174
-
175
-
176
-
177
-
178
-
179
-
180
-
181
-
182
-
183
-
184
-
185
-
186
-
187
-
188
-
189
-
190
-
191
-
192
-
193
-
194
-
195
-
196
-
197
-
198
-
199
-
200
-
201
-
202
-
203
-
204
-
205
-
206
-
207
-
208
-
209
-
210
-
211
-
212
-
213
-
214
-
215
-
216
-
217
-
218
-
219
-
220
-
221
-
222
-
223
-
224
-
225
-
226
-
227
-
228
-
229
-
230
-
231
-
232
-
233
-
234
-
235
-
236
-
237
-
238
-
239
-
240
-
241
-
242
-
243
-
244
-
245
-
246
-
247
-
248
-
249
-
250
-
251
-
252
-
253
-
254
-
255
-
256
-
257
-
258
-
259
-
260
-
261
-
262
-
263
-
264
-
265
-
266
-
267
-
268
-
269
-
270
-
271
-
272
-
273
-
274
-
275
-
276
-
277
-
278
-
279
-
280
-
281
-
282
-
283
-
284
-
285
-
286
-
287
-
288
-
289
-
290
-
291
-
292
-
293
-
294
-
295
-
296
-
297
-
298
-
299
-
300
-
301
-
302
-
303
-
304
-
305
-
306
-
307
-
308
-
309
-
310
-
311
-
312
-
313
-
314
-
315
-
316
-
317
-
318
-
319
-
320
-
321
-
322
-
323
-
324
-
325
-
326
-
327
-
328
-
329
-
330
-
331
-
332
-
333
-
334
-
335
-
336
-
337
-
338
-
339
-
340
-
341
-
342
-
343
-
344
-
345
-
346
-
347
-
348
-
349
-
350
-
351
-
352
-
353
-
354
-
355
-
356
-
357
-
358
-
359
-
360
-
361
-
362
-
363
-
364
-
365
-
366
 |
 |
155
Consolidated
Financial Statements
at 31 December 2013
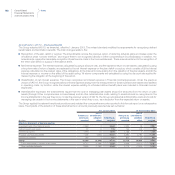
Composition and principal changes
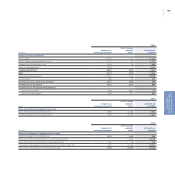
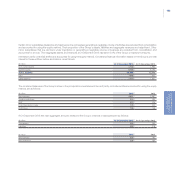
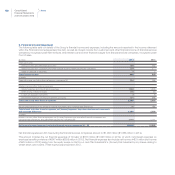
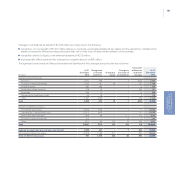
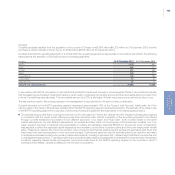
1. Net revenues
Net revenues are as follows:
(€ million) 2013 2012
Sales of goods 83,000 80,278
Services provided 2,043 2,049
Contract revenues 1,047 1,086
Interest income from customers and other financial income of financial services companies 239 277
Lease installments for assets sold with a buy-back commitment and for operating leases 226 244
Other 261 23
Total Net revenues 86,816 83,957
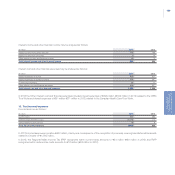
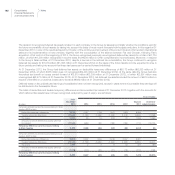
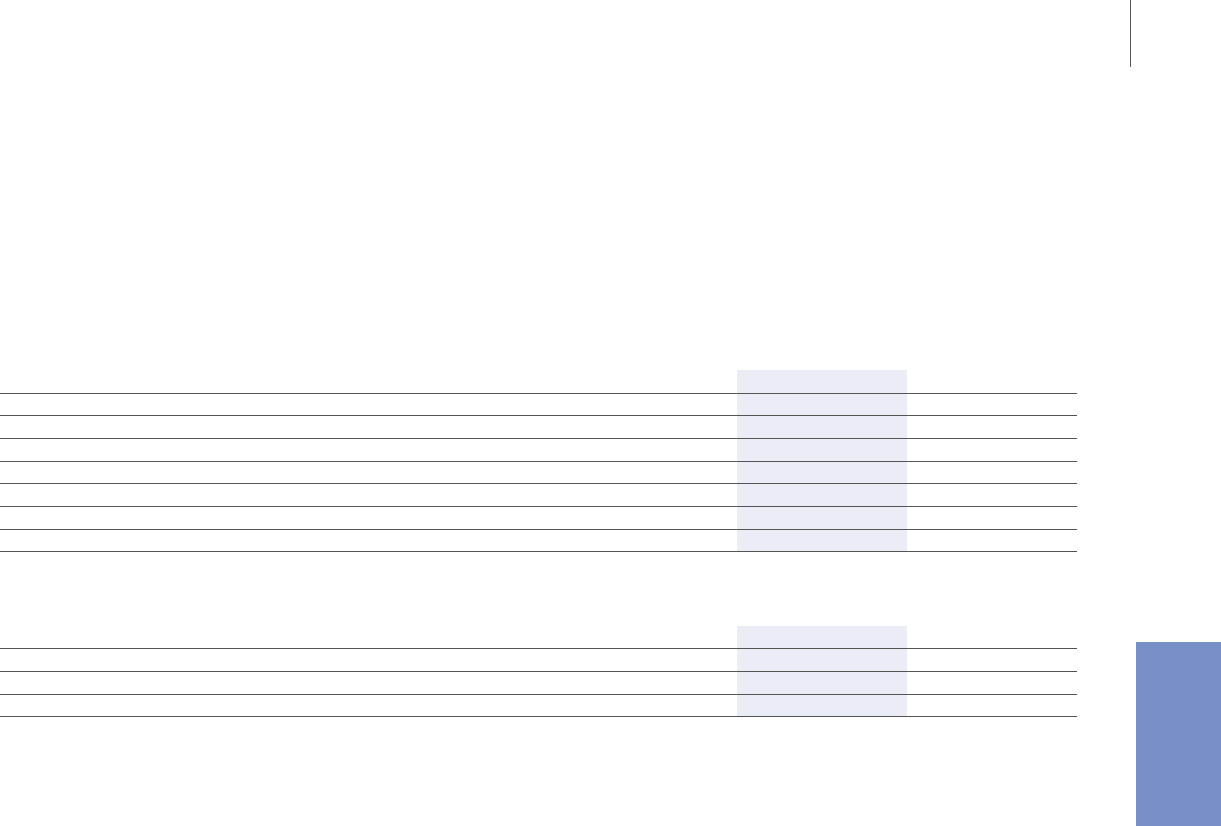
Net revenues are as follows:
(€ million) 2013 2012
Italy 6,937 7,275
Rest of the world 79,879 76,682
Total Net revenues 86,816 83,957
Net revenues in the Rest of the world in 2013 are attributed mainly to: United States, Canada and Mexico for €47,552 million (€45,170 million in
2012), Brazil for €8,431 million (€9,834 million in 2012), China for €4,438 million (€2,697 million in 2012), Germany for €3,054 million (€3,167
million in 2012), France for €1,957 million (€2,055 million in 2012), UK for €1,453 million (€1,429 million in 2012), Argentina for €1,439 million
(€1,179 million in 2012), Turkey for €1,268 million (€1,236 million in 2012) and Spain for €1,015 million (€873 million in 2012).
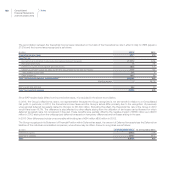
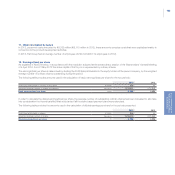
2. Cost of sales
Cost of sales amounts to €74,570 million in 2013 (€71,701 million in 2012) and the majority of it is made up by cost of materials and
components. The remaining costs principally include labor costs, consisting of direct and indirect wages, as well as depreciation of Property,
plant and equipment, amortization of Other intangible assets relating to production and transportation costs. Cost of sales also includes
warranty and product-related costs, estimated at the time of sale to dealer networks or to the end customer.
Cost of sales also includes €190 million (€158 million in 2012) of interest cost and other financial expenses from financial services companies.