Chrysler 2013 Annual Report Download - page 276
Download and view the complete annual report
Please find page 276 of the 2013 Chrysler annual report below. You can navigate through the pages in the report by either clicking on the pages listed below, or by using the keyword search tool below to find specific information within the annual report.-
 1
1 -
2
-
3
-
4
-
5
-
6
-
7
-
8
-
9
-
10
-
11
-
12
-
13
-
14
-
15
-
16
-
17
-
18
-
19
-
20
-
21
-
22
-
23
-
24
-
25
-
26
-
27
-
28
-
29
-
30
-
31
-
32
-
33
-
34
-
35
-
36
-
37
-
38
-
39
-
40
-
41
-
42
-
43
-
44
-
45
-
46
-
47
-
48
-
49
-
50
-
51
-
52
-
53
-
54
-
55
-
56
-
57
-
58
-
59
-
60
-
61
-
62
-
63
-
64
-
65
-
66
-
67
-
68
-
69
-
70
-
71
-
72
-
73
-
74
-
75
-
76
-
77
-
78
-
79
-
80
-
81
-
82
-
83
-
84
-
85
-
86
-
87
-
88
-
89
-
90
-
91
-
92
-
93
-
94
-
95
-
96
-
97
-
98
-
99
-
100
-
101
-
102
-
103
-
104
-
105
-
106
-
107
-
108
-
109
-
110
-
111
-
112
-
113
-
114
-
115
-
116
-
117
-
118
-
119
-
120
-
121
-
122
-
123
-
124
-
125
-
126
-
127
-
128
-
129
-
130
-
131
-
132
-
133
-
134
-
135
-
136
-
137
-
138
-
139
-
140
-
141
-
142
-
143
-
144
-
145
-
146
-
147
-
148
-
149
-
150
-
151
-
152
-
153
-
154
-
155
-
156
-
157
-
158
-
159
-
160
-
161
-
162
-
163
-
164
-
165
-
166
-
167
-
168
-
169
-
170
-
171
-
172
-
173
-
174
-
175
-
176
-
177
-
178
-
179
-
180
-
181
-
182
-
183
-
184
-
185
-
186
-
187
-
188
-
189
-
190
-
191
-
192
-
193
-
194
-
195
-
196
-
197
-
198
-
199
-
200
-
201
-
202
-
203
-
204
-
205
-
206
-
207
-
208
-
209
-
210
-
211
-
212
-
213
-
214
-
215
-
216
-
217
-
218
-
219
-
220
-
221
-
222
-
223
-
224
-
225
-
226
-
227
-
228
-
229
-
230
-
231
-
232
-
233
-
234
-
235
-
236
-
237
-
238
-
239
-
240
-
241
-
242
-
243
-
244
-
245
-
246
-
247
-
248
-
249
-
250
-
251
-
252
-
253
-
254
-
255
-
256
-
257
-
258
-
259
-
260
-
261
-
262
-
263
-
264
-
265
-
 266
266 -
 267
267 -
 268
268 -
 269
269 -
 270
270 -
 271
271 -
 272
272 -
 273
273 -
 274
274 -
 275
275 -
 276
276 -
 277
277 -
 278
278 -
 279
279 -
 280
280 -
 281
281 -
 282
282 -
 283
283 -
 284
284 -
 285
285 -
 286
286 -
287
-
288
-
289
-
290
-
291
-
292
-
293
-
294
-
295
-
296
-
297
-
298
-
299
-
300
-
301
-
302
-
303
-
304
-
305
-
306
-
307
-
308
-
309
-
310
-
311
-
312
-
313
-
314
-
315
-
316
-
317
-
318
-
319
-
320
-
321
-
322
-
323
-
324
-
325
-
326
-
327
-
328
-
329
-
330
-
331
-
332
-
333
-
334
-
335
-
336
-
337
-
338
-
339
-
340
-
341
-
342
-
343
-
344
-
345
-
346
-
347
-
348
-
349
-
350
-
351
-
352
-
353
-
354
-
355
-
356
-
357
-
358
-
359
-
360
-
361
-
362
-
363
-
364
-
365
-
366
 |
 |

275
Fiat S.p.A. Statutory
Financial Statements
at 31 December 2013
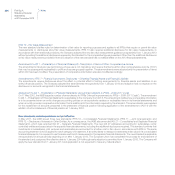
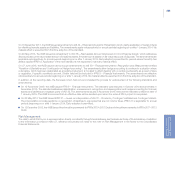
Depreciation
Depreciation is calculated on a straight-line basis over the estimated useful life of an asset as follows:
Annual depreciation rate
Buildings 3%
Plants 10%
Furniture 12%
Fixtures 20%
Vehicles 25%
Land is not depreciated.
Impairment
At least annually, the Company evaluates recoverability of the value of intangible assets, tangible assets and investments in subsidiaries and
associates, in order to determine whether those assets have suffered a loss in value. If there are indications of impairment, the carrying amount
of the asset is reduced to its recoverable amount.
For investments in subsidiaries and associates that have distributed a dividend, the following are also considered indicators of impairment:
if the carrying amount of the investee in the separate financial statements exceeds the book value of equity (including any associated
goodwill) as recognized in the consolidated financial statements
if dividends exceed the comprehensive income of the investee for the period to which the dividend relates
The recoverable amount of an asset is the higher of fair value less disposal costs and its value in use.
When testing for impairment of investments whose market value (fair value less disposal costs) cannot be reliably measured, the recoverable
amount is based on value in use, which – in line with the requirements of paragraph 33 of IAS 28 – is determined by estimating the present
value of future cash flows and a theoretical terminal value.
Where impairment of an asset subsequently reverses, the carrying amount of that asset is increased to the revised estimate of its recoverable
amount, not to exceed the carrying amount that would have been determined had no impairment loss been recognized. A reversal of an
impairment loss is recognized immediately in the income statement.
Financial instruments
Presentation
Financial instruments held by the Company are classified in the financial statements as follows:
Non-current assets: investments, other financial assets, other non-current assets
Current assets: trade receivables, current financial receivables, other current receivables, cash and cash equivalents
Non-current liabilities: non-current debt, other non-current liabilities
Current liabilities: trade payables, current debt (including asset-backed financing), other debt