Chrysler 2013 Annual Report Download - page 146
Download and view the complete annual report
Please find page 146 of the 2013 Chrysler annual report below. You can navigate through the pages in the report by either clicking on the pages listed below, or by using the keyword search tool below to find specific information within the annual report.-
 1
1 -
2
-
3
-
4
-
5
-
6
-
7
-
8
-
9
-
10
-
11
-
12
-
13
-
14
-
15
-
16
-
17
-
18
-
19
-
20
-
21
-
22
-
23
-
24
-
25
-
26
-
27
-
28
-
29
-
30
-
31
-
32
-
33
-
34
-
35
-
36
-
37
-
38
-
39
-
40
-
41
-
42
-
43
-
44
-
45
-
46
-
47
-
48
-
49
-
50
-
51
-
52
-
53
-
54
-
55
-
56
-
57
-
58
-
59
-
60
-
61
-
62
-
63
-
64
-
65
-
66
-
67
-
68
-
69
-
70
-
71
-
72
-
73
-
74
-
75
-
76
-
77
-
78
-
79
-
80
-
81
-
82
-
83
-
84
-
85
-
86
-
87
-
88
-
89
-
90
-
91
-
92
-
93
-
94
-
95
-
96
-
97
-
98
-
99
-
100
-
101
-
102
-
103
-
104
-
105
-
106
-
107
-
108
-
109
-
110
-
111
-
112
-
113
-
114
-
115
-
116
-
117
-
118
-
119
-
120
-
121
-
122
-
123
-
124
-
125
-
126
-
127
-
128
-
129
-
130
-
131
-
132
-
133
-
134
-
135
-
 136
136 -
 137
137 -
 138
138 -
 139
139 -
 140
140 -
 141
141 -
 142
142 -
 143
143 -
 144
144 -
 145
145 -
 146
146 -
 147
147 -
 148
148 -
 149
149 -
 150
150 -
 151
151 -
 152
152 -
 153
153 -
 154
154 -
 155
155 -
 156
156 -
157
-
158
-
159
-
160
-
161
-
162
-
163
-
164
-
165
-
166
-
167
-
168
-
169
-
170
-
171
-
172
-
173
-
174
-
175
-
176
-
177
-
178
-
179
-
180
-
181
-
182
-
183
-
184
-
185
-
186
-
187
-
188
-
189
-
190
-
191
-
192
-
193
-
194
-
195
-
196
-
197
-
198
-
199
-
200
-
201
-
202
-
203
-
204
-
205
-
206
-
207
-
208
-
209
-
210
-
211
-
212
-
213
-
214
-
215
-
216
-
217
-
218
-
219
-
220
-
221
-
222
-
223
-
224
-
225
-
226
-
227
-
228
-
229
-
230
-
231
-
232
-
233
-
234
-
235
-
236
-
237
-
238
-
239
-
240
-
241
-
242
-
243
-
244
-
245
-
246
-
247
-
248
-
249
-
250
-
251
-
252
-
253
-
254
-
255
-
256
-
257
-
258
-
259
-
260
-
261
-
262
-
263
-
264
-
265
-
266
-
267
-
268
-
269
-
270
-
271
-
272
-
273
-
274
-
275
-
276
-
277
-
278
-
279
-
280
-
281
-
282
-
283
-
284
-
285
-
286
-
287
-
288
-
289
-
290
-
291
-
292
-
293
-
294
-
295
-
296
-
297
-
298
-
299
-
300
-
301
-
302
-
303
-
304
-
305
-
306
-
307
-
308
-
309
-
310
-
311
-
312
-
313
-
314
-
315
-
316
-
317
-
318
-
319
-
320
-
321
-
322
-
323
-
324
-
325
-
326
-
327
-
328
-
329
-
330
-
331
-
332
-
333
-
334
-
335
-
336
-
337
-
338
-
339
-
340
-
341
-
342
-
343
-
344
-
345
-
346
-
347
-
348
-
349
-
350
-
351
-
352
-
353
-
354
-
355
-
356
-
357
-
358
-
359
-
360
-
361
-
362
-
363
-
364
-
365
-
366
 |
 |

145
Consolidated
Financial Statements
at 31 December 2013
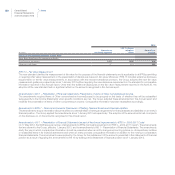
Firstly, the recoverable amounts of the assets of specific EMEA CGUs were tested, identified as plants, machinery and equipment as well
as the associated intangible assets dedicated to the production of specific platforms and powertrains. This impairment analysis led to the
recognition of impairment on Development costs of €66 million and on Other tangible assets of €37 million (€108 million in 2012 mainly related
to Development costs and Other tangible assets). These impairment losses were recognized under Other unusual expenses (€93 million)
and under Operating costs (€10 million). A similar process was carried out also for specific CGUs within the Components operating segment
and for the Maserati CGU, leading to the recognition of an impairment of Property, plant and equipment for €30 million and an impairment of
Development costs of €65 million, respectively.
Secondly, following the above mentioned decline in demand, at 31 December 2012 and 2013, the Group deemed necessary to test the
recoverable amount of the Net Capital Employed pertaining to the EMEA operating segment as a whole, by determining its value in use with
the following assumptions:
reference scenario was based on 2014 budget, the expected trading conditions and the automotive market trends for the 2015-2019 period,
based on analysis and studies carried out by primary independent analysts (IHS-Global Insight), in line with the announced strategic decision
to leverage historical premium brand heritage (Alfa Romeo) and the success of the new 500 family;
the six year period has been deemed necessary to take into account the full cycle of new vehicles introduced reflecting the benefits arising
from the capital expenditure devoted to the product portfolio enrichment and renewal, largely concentrated in 2015-2016;
the expected future cash flows, represented by the projected trading profit plus depreciation and amortization and reduced by expected
capital expenditure, include a normalized terminal period used to estimate the future results beyond the time period explicitly considered.
This terminal period was assumed substantially in line with 2017-2019 amounts. The long-term growth rate was set at zero;
the expected future cash flows have been discounted using a pre-tax Weighted Average Cost of Capital (“WACC”) of 12.20% (13.14% in
2012). This WACC reflects the current market assessment of the time value of money for the period being considered and the risks specific
to the EMEA region. The WACC was calculated by referring among others to the yield curve of 10 years European government bonds and
to Fiat cost of debt.
The recoverable amount of the net assets of the EMEA operating segment was higher than the corresponding book value. In addition,
sensitivity analysis were performed by simulating two different scenarios: a) WACC was increased by 1% for 2017, 2% for 2018 and 3% for
2019 and for Terminal Value; b) cash-flows were reduced by estimating the impact of a 5% decrease in the European car market demand for
2015, 7.5% for 2016 and 10% for 2017-2019 as compared to the base assumptions. In all cases the recoverable amount of the net assets
continued to be higher than their book value.
The estimates and assumptions described reflect the Group’s current available knowledge as to the expected future development of the
businesses and are based on an assessment of the future development of the markets and the car industry, which remain subject to a high
degree of uncertainty due to the continuation of the economic difficulties in most countries of the Eurozone and its effects on the industry. More
specifically, considering the uncertainty, a future worsening in the economic environment in the Eurozone that is not reflected in these Group
assumptions, could result in actual performance that differs from the original estimates, and might therefore require adjustments to the carrying
amounts of certain non-current assets in future periods.