Chrysler 2013 Annual Report Download - page 53
Download and view the complete annual report
Please find page 53 of the 2013 Chrysler annual report below. You can navigate through the pages in the report by either clicking on the pages listed below, or by using the keyword search tool below to find specific information within the annual report.-
 1
1 -
2
-
3
-
4
-
5
-
6
-
7
-
8
-
9
-
10
-
11
-
12
-
13
-
14
-
15
-
16
-
17
-
18
-
19
-
20
-
21
-
22
-
23
-
24
-
25
-
26
-
27
-
28
-
29
-
30
-
31
-
32
-
33
-
34
-
35
-
36
-
37
-
38
-
39
-
40
-
41
-
42
-
 43
43 -
 44
44 -
 45
45 -
 46
46 -
 47
47 -
 48
48 -
 49
49 -
 50
50 -
 51
51 -
 52
52 -
 53
53 -
 54
54 -
 55
55 -
 56
56 -
 57
57 -
 58
58 -
 59
59 -
 60
60 -
 61
61 -
 62
62 -
 63
63 -
64
-
65
-
66
-
67
-
68
-
69
-
70
-
71
-
72
-
73
-
74
-
75
-
76
-
77
-
78
-
79
-
80
-
81
-
82
-
83
-
84
-
85
-
86
-
87
-
88
-
89
-
90
-
91
-
92
-
93
-
94
-
95
-
96
-
97
-
98
-
99
-
100
-
101
-
102
-
103
-
104
-
105
-
106
-
107
-
108
-
109
-
110
-
111
-
112
-
113
-
114
-
115
-
116
-
117
-
118
-
119
-
120
-
121
-
122
-
123
-
124
-
125
-
126
-
127
-
128
-
129
-
130
-
131
-
132
-
133
-
134
-
135
-
136
-
137
-
138
-
139
-
140
-
141
-
142
-
143
-
144
-
145
-
146
-
147
-
148
-
149
-
150
-
151
-
152
-
153
-
154
-
155
-
156
-
157
-
158
-
159
-
160
-
161
-
162
-
163
-
164
-
165
-
166
-
167
-
168
-
169
-
170
-
171
-
172
-
173
-
174
-
175
-
176
-
177
-
178
-
179
-
180
-
181
-
182
-
183
-
184
-
185
-
186
-
187
-
188
-
189
-
190
-
191
-
192
-
193
-
194
-
195
-
196
-
197
-
198
-
199
-
200
-
201
-
202
-
203
-
204
-
205
-
206
-
207
-
208
-
209
-
210
-
211
-
212
-
213
-
214
-
215
-
216
-
217
-
218
-
219
-
220
-
221
-
222
-
223
-
224
-
225
-
226
-
227
-
228
-
229
-
230
-
231
-
232
-
233
-
234
-
235
-
236
-
237
-
238
-
239
-
240
-
241
-
242
-
243
-
244
-
245
-
246
-
247
-
248
-
249
-
250
-
251
-
252
-
253
-
254
-
255
-
256
-
257
-
258
-
259
-
260
-
261
-
262
-
263
-
264
-
265
-
266
-
267
-
268
-
269
-
270
-
271
-
272
-
273
-
274
-
275
-
276
-
277
-
278
-
279
-
280
-
281
-
282
-
283
-
284
-
285
-
286
-
287
-
288
-
289
-
290
-
291
-
292
-
293
-
294
-
295
-
296
-
297
-
298
-
299
-
300
-
301
-
302
-
303
-
304
-
305
-
306
-
307
-
308
-
309
-
310
-
311
-
312
-
313
-
314
-
315
-
316
-
317
-
318
-
319
-
320
-
321
-
322
-
323
-
324
-
325
-
326
-
327
-
328
-
329
-
330
-
331
-
332
-
333
-
334
-
335
-
336
-
337
-
338
-
339
-
340
-
341
-
342
-
343
-
344
-
345
-
346
-
347
-
348
-
349
-
350
-
351
-
352
-
353
-
354
-
355
-
356
-
357
-
358
-
359
-
360
-
361
-
362
-
363
-
364
-
365
-
366
 |
 |

52 Report on Operations
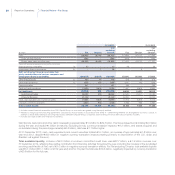
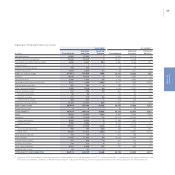
Consolidated Statement of Financial Position at 31 December 2013
Total assets were €86.8 billion at 31 December 2013, increasing €4.7 billion over year-end 2012 (€82.1 billion).
Non-current assets(1) totaled €47.6 billion, €2.1 billion higher than year-end 2012 (€4.3 billion net of currency translation impacts). The
increase related primarily to the change in deferred tax assets (€1.3 billion net of currency effects), including a €1.7 billion positive impact
from the recognition of deferred tax assets related to Chrysler, a €2.6 billion increase in fixed assets (net of depreciation and amortization) and
consolidation of the assets of VM Motori from 1 July 2013(2).
Current assets(3) totaled €39.2 billion, an increase of €2.6 billion for the year. At constant exchange rates, current assets were €4.6 billion
higher, primarily due to increases in net inventory (€1.4 billion) and cash and cash equivalents (€2.7 billion, excluding currency translation
effects).
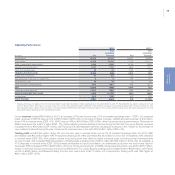
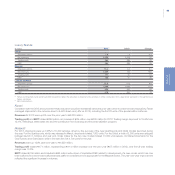
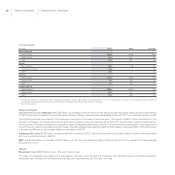
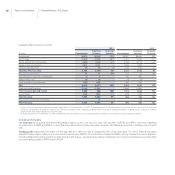
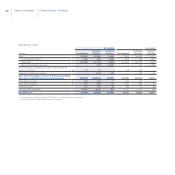
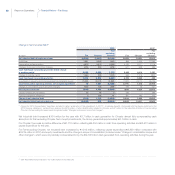
Working capital (net of items relating to vehicles sold under buy-back commitments) was a negative €10,935 million, representing a
€1,004 million decrease over the negative €9,931 million at 31 December 2012.
(€ million) 31.12.2013 31.12.2012 Change
Inventory (a) 8,975 8,340 635
Trade receivables 2,406 2,702 (296)
Trade payables (17,235) (16,558) (677)
Other current receivables/(payables) & current taxes receivable/(payable) (b) (5,081) (4,415) (666)
Working capital (10,935) (9,931) (1,004)
(a) Inventory is reported net of the value of vehicles sold under buy-back commitments, which includes vehicles still in use by customers and vehicles that have been
repurchased and are held for sale.
(b) Other current payables, included under other current receivables/(payables) & current taxes receivable/(payable), are stated net of amounts due to customers in relation
to vehicles sold under buy-back commitments, which consist of the repurchase amount payable at the end of the lease period, together with the value of any lease
installments received in advance. The value at the beginning of the contract period, equivalent to the difference between the sale price and the repurchase amount, is
recognized on a straight-line basis over the contract period.
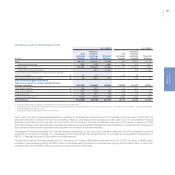
(1) Non-Currents assets include: Intangible assets, Property, plant and equipment, Investments and other financial assets, Leased assets, Defined benefit plan assets and
Deferred tax assets. See also Fiat Group Consolidated Financial Statements and Notes.
(2) Fiat acquired an initial 50% interest in VM Motori in 2011. On 1 July 2013, following exercise of the put option held by the JV partner, Fiat acquired control, pursuant to
IAS 27 – Consolidated and Separate Financial Statements, and the investee was consolidated on a line-by-line basis from that date. For more information, see Notes to
the Consolidated Financial Statements at 31 December 2013 – “Scope of consolidation” .
(3) Current assets include: Inventories, Trade receivables, Receivables from financing activities, Current tax receivables, Other current assets, Current financial assets and
Cash and cash equivalents. See also Fiat Group Consolidated Financial Statements and Notes.
Financial Review – Fiat Group