Chrysler 2013 Annual Report Download - page 166
Download and view the complete annual report
Please find page 166 of the 2013 Chrysler annual report below. You can navigate through the pages in the report by either clicking on the pages listed below, or by using the keyword search tool below to find specific information within the annual report.-
 1
1 -
2
-
3
-
4
-
5
-
6
-
7
-
8
-
9
-
10
-
11
-
12
-
13
-
14
-
15
-
16
-
17
-
18
-
19
-
20
-
21
-
22
-
23
-
24
-
25
-
26
-
27
-
28
-
29
-
30
-
31
-
32
-
33
-
34
-
35
-
36
-
37
-
38
-
39
-
40
-
41
-
42
-
43
-
44
-
45
-
46
-
47
-
48
-
49
-
50
-
51
-
52
-
53
-
54
-
55
-
56
-
57
-
58
-
59
-
60
-
61
-
62
-
63
-
64
-
65
-
66
-
67
-
68
-
69
-
70
-
71
-
72
-
73
-
74
-
75
-
76
-
77
-
78
-
79
-
80
-
81
-
82
-
83
-
84
-
85
-
86
-
87
-
88
-
89
-
90
-
91
-
92
-
93
-
94
-
95
-
96
-
97
-
98
-
99
-
100
-
101
-
102
-
103
-
104
-
105
-
106
-
107
-
108
-
109
-
110
-
111
-
112
-
113
-
114
-
115
-
116
-
117
-
118
-
119
-
120
-
121
-
122
-
123
-
124
-
125
-
126
-
127
-
128
-
129
-
130
-
131
-
132
-
133
-
134
-
135
-
136
-
137
-
138
-
139
-
140
-
141
-
142
-
143
-
144
-
145
-
146
-
147
-
148
-
149
-
150
-
151
-
152
-
153
-
154
-
155
-
 156
156 -
 157
157 -
 158
158 -
 159
159 -
 160
160 -
 161
161 -
 162
162 -
 163
163 -
 164
164 -
 165
165 -
 166
166 -
 167
167 -
 168
168 -
 169
169 -
 170
170 -
 171
171 -
 172
172 -
 173
173 -
 174
174 -
 175
175 -
 176
176 -
177
-
178
-
179
-
180
-
181
-
182
-
183
-
184
-
185
-
186
-
187
-
188
-
189
-
190
-
191
-
192
-
193
-
194
-
195
-
196
-
197
-
198
-
199
-
200
-
201
-
202
-
203
-
204
-
205
-
206
-
207
-
208
-
209
-
210
-
211
-
212
-
213
-
214
-
215
-
216
-
217
-
218
-
219
-
220
-
221
-
222
-
223
-
224
-
225
-
226
-
227
-
228
-
229
-
230
-
231
-
232
-
233
-
234
-
235
-
236
-
237
-
238
-
239
-
240
-
241
-
242
-
243
-
244
-
245
-
246
-
247
-
248
-
249
-
250
-
251
-
252
-
253
-
254
-
255
-
256
-
257
-
258
-
259
-
260
-
261
-
262
-
263
-
264
-
265
-
266
-
267
-
268
-
269
-
270
-
271
-
272
-
273
-
274
-
275
-
276
-
277
-
278
-
279
-
280
-
281
-
282
-
283
-
284
-
285
-
286
-
287
-
288
-
289
-
290
-
291
-
292
-
293
-
294
-
295
-
296
-
297
-
298
-
299
-
300
-
301
-
302
-
303
-
304
-
305
-
306
-
307
-
308
-
309
-
310
-
311
-
312
-
313
-
314
-
315
-
316
-
317
-
318
-
319
-
320
-
321
-
322
-
323
-
324
-
325
-
326
-
327
-
328
-
329
-
330
-
331
-
332
-
333
-
334
-
335
-
336
-
337
-
338
-
339
-
340
-
341
-
342
-
343
-
344
-
345
-
346
-
347
-
348
-
349
-
350
-
351
-
352
-
353
-
354
-
355
-
356
-
357
-
358
-
359
-
360
-
361
-
362
-
363
-
364
-
365
-
366
 |
 |

165
Consolidated
Financial Statements
at 31 December 2013
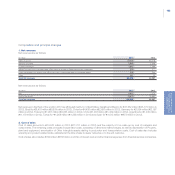
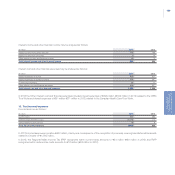
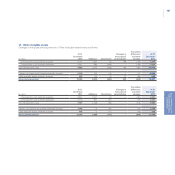
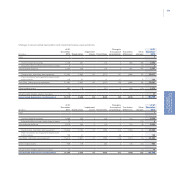
Goodwill
Goodwill principally resulted from the acquisition of the control of Chrysler for €8,967 million (€9,372 million at 31 December 2012) and the
purchase of certain interests in Ferrari S.p.A. for €786 million (€786 million at 31 December 2012).
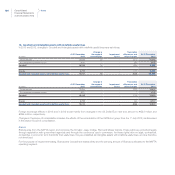
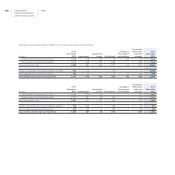
Goodwill is allocated to operating segments or to CGUs within the operating segments as appropriate, in accordance with IAS 36. The following
table presents the allocation of Goodwill across the operating segments:
(€ million) At 31 December 2013 At 31 December 2012
NAFTA 7,330 7,661
APAC 968 1,012
LATAM 461 482
EMEA 208 217
Luxury Brands 786 786
Components 51 51
Other activities 35 21
Goodwill (net carrying amount) 9,839 10,230
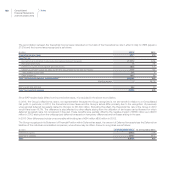
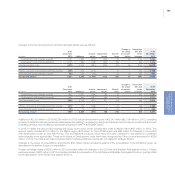
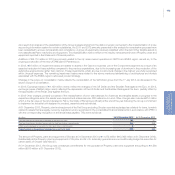
In accordance with IAS 36, Goodwill is not amortized and is tested for impairment annually or more frequently if facts or circumstances indicate
that the asset may be impaired. Impairment testing is performed by comparing the carrying amount and the recoverable amount of each CGU
to which Goodwill has been allocated. The recoverable amount of a CGU is the higher of its fair value less costs to sell and its value in use.
The assumptions used in this process represent the management’s best estimate for the period under consideration.
Goodwill allocated to the NAFTA operating segment represents approximately 75% of the Group’s total Goodwill. Additionally, all of the
carrying value of the Group’s Brands was included within the NAFTA operating segment as described before. The estimate of the value in use
of the NAFTA operating segment for purposes of performing the annual impairment test was based on the following assumptions:
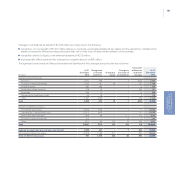
The expected future cash flows covering the period from 2014 through 2017 have been derived from the Chrysler business plan prepared
in connection with the recent public offering process (then withdrawn after the Fiat acquisition of the securities proposed to be offered
through a private transaction) and based on two different scenarios: “Low Case” and “High Case”, both of which based on the same
market assumptions, but with different assumptions on variable and fixed costs. For the purpose of this impairment analysis, the “Low
Case” scenario has been considered. More specifically, in making the estimates, expected EBITDA for the periods under consideration
was adjusted to reflect the expected capital expenditure and monetary contributions to pension plans and other post-employment benefit
plans. These flows relate to the CGU in its condition when preparing the Financial statements and exclude the estimated cash flows that
might arise from restructuring plans or other structural changes. Volumes and sales mix used for estimating the future cash flow are based
on analyses and studies carried out by primary independent analysts, including in particular IHS – Global Insight and Ward’s Automotive and
on management assumptions. These assumptions are considered reasonable and sustainable and represent the best estimate of expected
conditions regarding market trends and segment, brand and model share for the NAFTA operating segment in the countries in which it
operates (United States, Canada and Mexico) over the period considered.