Chrysler 2013 Annual Report Download - page 192
Download and view the complete annual report
Please find page 192 of the 2013 Chrysler annual report below. You can navigate through the pages in the report by either clicking on the pages listed below, or by using the keyword search tool below to find specific information within the annual report.-
 1
1 -
2
-
3
-
4
-
5
-
6
-
7
-
8
-
9
-
10
-
11
-
12
-
13
-
14
-
15
-
16
-
17
-
18
-
19
-
20
-
21
-
22
-
23
-
24
-
25
-
26
-
27
-
28
-
29
-
30
-
31
-
32
-
33
-
34
-
35
-
36
-
37
-
38
-
39
-
40
-
41
-
42
-
43
-
44
-
45
-
46
-
47
-
48
-
49
-
50
-
51
-
52
-
53
-
54
-
55
-
56
-
57
-
58
-
59
-
60
-
61
-
62
-
63
-
64
-
65
-
66
-
67
-
68
-
69
-
70
-
71
-
72
-
73
-
74
-
75
-
76
-
77
-
78
-
79
-
80
-
81
-
82
-
83
-
84
-
85
-
86
-
87
-
88
-
89
-
90
-
91
-
92
-
93
-
94
-
95
-
96
-
97
-
98
-
99
-
100
-
101
-
102
-
103
-
104
-
105
-
106
-
107
-
108
-
109
-
110
-
111
-
112
-
113
-
114
-
115
-
116
-
117
-
118
-
119
-
120
-
121
-
122
-
123
-
124
-
125
-
126
-
127
-
128
-
129
-
130
-
131
-
132
-
133
-
134
-
135
-
136
-
137
-
138
-
139
-
140
-
141
-
142
-
143
-
144
-
145
-
146
-
147
-
148
-
149
-
150
-
151
-
152
-
153
-
154
-
155
-
156
-
157
-
158
-
159
-
160
-
161
-
162
-
163
-
164
-
165
-
166
-
167
-
168
-
169
-
170
-
171
-
172
-
173
-
174
-
175
-
176
-
177
-
178
-
179
-
180
-
181
-
 182
182 -
 183
183 -
 184
184 -
 185
185 -
 186
186 -
 187
187 -
 188
188 -
 189
189 -
 190
190 -
 191
191 -
 192
192 -
 193
193 -
 194
194 -
 195
195 -
 196
196 -
 197
197 -
 198
198 -
 199
199 -
 200
200 -
 201
201 -
 202
202 -
203
-
204
-
205
-
206
-
207
-
208
-
209
-
210
-
211
-
212
-
213
-
214
-
215
-
216
-
217
-
218
-
219
-
220
-
221
-
222
-
223
-
224
-
225
-
226
-
227
-
228
-
229
-
230
-
231
-
232
-
233
-
234
-
235
-
236
-
237
-
238
-
239
-
240
-
241
-
242
-
243
-
244
-
245
-
246
-
247
-
248
-
249
-
250
-
251
-
252
-
253
-
254
-
255
-
256
-
257
-
258
-
259
-
260
-
261
-
262
-
263
-
264
-
265
-
266
-
267
-
268
-
269
-
270
-
271
-
272
-
273
-
274
-
275
-
276
-
277
-
278
-
279
-
280
-
281
-
282
-
283
-
284
-
285
-
286
-
287
-
288
-
289
-
290
-
291
-
292
-
293
-
294
-
295
-
296
-
297
-
298
-
299
-
300
-
301
-
302
-
303
-
304
-
305
-
306
-
307
-
308
-
309
-
310
-
311
-
312
-
313
-
314
-
315
-
316
-
317
-
318
-
319
-
320
-
321
-
322
-
323
-
324
-
325
-
326
-
327
-
328
-
329
-
330
-
331
-
332
-
333
-
334
-
335
-
336
-
337
-
338
-
339
-
340
-
341
-
342
-
343
-
344
-
345
-
346
-
347
-
348
-
349
-
350
-
351
-
352
-
353
-
354
-
355
-
356
-
357
-
358
-
359
-
360
-
361
-
362
-
363
-
364
-
365
-
366
 |
 |

191
Consolidated
Financial Statements
at 31 December 2013
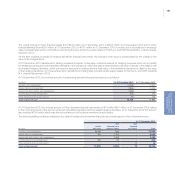
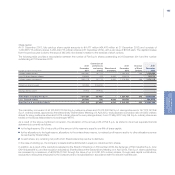
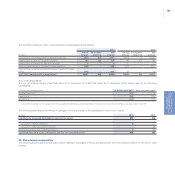
With specific reference to the options under the November 2006 Stock Option Plan, for which vesting was subject to the achievement of pre-
established profitability targets, only the first tranche of those rights had vested as the profitability targets originally established for the 3-year
period 2008-2010 were not met.
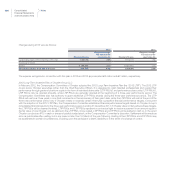
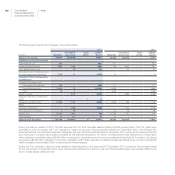
A summary of the terms of the stock option plans outstanding at 31 December 2013 is as follows:
Rights granted to managers Rights granted to the Chief Executive Officer
Exercise price (€)
Options
outstanding at
31 December 2013
Options
outstanding at
31 December 2012
Average remaining
contractual life
(years)
Options
outstanding at
31 December 2013
Options
outstanding at
31 December 2012
Average remaining
contractual life
(years)
6.583 -- - 10,670,000 10,670,000 2.0
13.370 1,240,000 1,576,875 0.8 6,250,000 6,250,000 0.8
Total 1,240,000 1,576,875 16,920,000 16,920,000
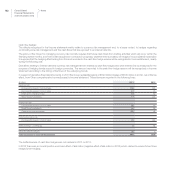
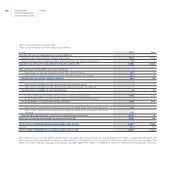
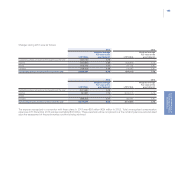
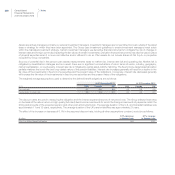
Changes during the year 2013 were as follows:
Rights granted to managers Rights granted to the Chief Executive Officer
Number of options
Average
exercise price (€) Number of options
Average
exercise price (€)
Outstanding at the beginning of the year 1,576,875 13.37 16,920,000 9.09
Granted - - - -
Forfeited - - - -
Exercised (285,000) 13.37 - -
Expired (51,875) 13.37 - -
Outstanding at 31 December 2013 1,240,000 13.37 16,920,000 9.09
Exercisable at 31 December 2013 1,240,000 13.37 16,920,000 9.09
Exercisable at 31 December 2012 1,576,875 13.37 16,920,000 9.09
As they were already fully vested at 31 December 2010, the above stock option plans did not lead to any nominal cost for 2013 and 2012.