Chrysler 2013 Annual Report Download - page 56
Download and view the complete annual report
Please find page 56 of the 2013 Chrysler annual report below. You can navigate through the pages in the report by either clicking on the pages listed below, or by using the keyword search tool below to find specific information within the annual report.-
 1
1 -
2
-
3
-
4
-
5
-
6
-
7
-
8
-
9
-
10
-
11
-
12
-
13
-
14
-
15
-
16
-
17
-
18
-
19
-
20
-
21
-
22
-
23
-
24
-
25
-
26
-
27
-
28
-
29
-
30
-
31
-
32
-
33
-
34
-
35
-
36
-
37
-
38
-
39
-
40
-
41
-
42
-
43
-
44
-
45
-
 46
46 -
 47
47 -
 48
48 -
 49
49 -
 50
50 -
 51
51 -
 52
52 -
 53
53 -
 54
54 -
 55
55 -
 56
56 -
 57
57 -
 58
58 -
 59
59 -
 60
60 -
 61
61 -
 62
62 -
 63
63 -
 64
64 -
 65
65 -
 66
66 -
67
-
68
-
69
-
70
-
71
-
72
-
73
-
74
-
75
-
76
-
77
-
78
-
79
-
80
-
81
-
82
-
83
-
84
-
85
-
86
-
87
-
88
-
89
-
90
-
91
-
92
-
93
-
94
-
95
-
96
-
97
-
98
-
99
-
100
-
101
-
102
-
103
-
104
-
105
-
106
-
107
-
108
-
109
-
110
-
111
-
112
-
113
-
114
-
115
-
116
-
117
-
118
-
119
-
120
-
121
-
122
-
123
-
124
-
125
-
126
-
127
-
128
-
129
-
130
-
131
-
132
-
133
-
134
-
135
-
136
-
137
-
138
-
139
-
140
-
141
-
142
-
143
-
144
-
145
-
146
-
147
-
148
-
149
-
150
-
151
-
152
-
153
-
154
-
155
-
156
-
157
-
158
-
159
-
160
-
161
-
162
-
163
-
164
-
165
-
166
-
167
-
168
-
169
-
170
-
171
-
172
-
173
-
174
-
175
-
176
-
177
-
178
-
179
-
180
-
181
-
182
-
183
-
184
-
185
-
186
-
187
-
188
-
189
-
190
-
191
-
192
-
193
-
194
-
195
-
196
-
197
-
198
-
199
-
200
-
201
-
202
-
203
-
204
-
205
-
206
-
207
-
208
-
209
-
210
-
211
-
212
-
213
-
214
-
215
-
216
-
217
-
218
-
219
-
220
-
221
-
222
-
223
-
224
-
225
-
226
-
227
-
228
-
229
-
230
-
231
-
232
-
233
-
234
-
235
-
236
-
237
-
238
-
239
-
240
-
241
-
242
-
243
-
244
-
245
-
246
-
247
-
248
-
249
-
250
-
251
-
252
-
253
-
254
-
255
-
256
-
257
-
258
-
259
-
260
-
261
-
262
-
263
-
264
-
265
-
266
-
267
-
268
-
269
-
270
-
271
-
272
-
273
-
274
-
275
-
276
-
277
-
278
-
279
-
280
-
281
-
282
-
283
-
284
-
285
-
286
-
287
-
288
-
289
-
290
-
291
-
292
-
293
-
294
-
295
-
296
-
297
-
298
-
299
-
300
-
301
-
302
-
303
-
304
-
305
-
306
-
307
-
308
-
309
-
310
-
311
-
312
-
313
-
314
-
315
-
316
-
317
-
318
-
319
-
320
-
321
-
322
-
323
-
324
-
325
-
326
-
327
-
328
-
329
-
330
-
331
-
332
-
333
-
334
-
335
-
336
-
337
-
338
-
339
-
340
-
341
-
342
-
343
-
344
-
345
-
346
-
347
-
348
-
349
-
350
-
351
-
352
-
353
-
354
-
355
-
356
-
357
-
358
-
359
-
360
-
361
-
362
-
363
-
364
-
365
-
366
 |
 |

55
Report on
Operations
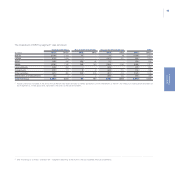
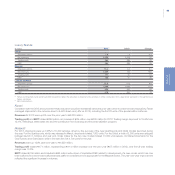
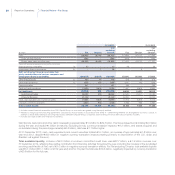
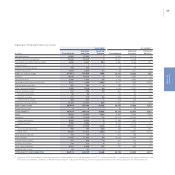
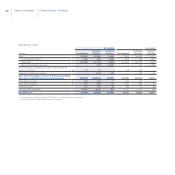
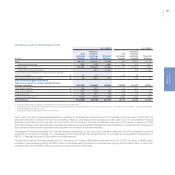
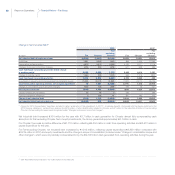
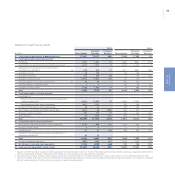
Industrial Activities and Financial Services – Results for 2013
In order to provide a better insight into the financial position and performance of the Group and going beyond the requirements of IFRS 8 - Operating
segments, the following tables provide a breakdown of the consolidated statements of income, financial position and cash flows between
“Industrial Activities” and “Financial Services”. In more detail, the separate evidence of the financial debt between industrial activities and financial
services is based on the different sources of cash flows used for the repayment: represented by cash from operations for industrial activities and
by collection of financial receivables for financial services. Consequently, a separate analysis of the financial structure in terms of debt to equity
and other ratios is considered appropriate.
Financial Services includes companies that provide retail and dealer finance, leasing and rental services in support of the mass-market brands
and for the luxury brands.
Financial Services also includes FGA Capital (the joint venture between Fiat Group Automobiles and Crédit Agricole Group), which is accounted
for under the equity method.
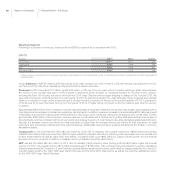
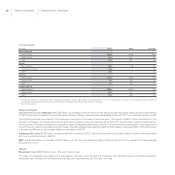
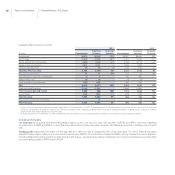
Basis of analysis
The separation between Industrial Activities and Financial Services represents a sub-consolidation prepared on the basis of the activities of
each Group company.
Investments held by companies belonging to one area in companies included in the other area are accounted for under the equity method.
To provide a more meaningful presentation of net profit, the results of investments accounted for in this manner are classified in the income
statement under Result from intersegment investments.
The holding companies (Fiat S.p.A., Fiat Partecipazioni S.p.A. and Fiat North America LLC) are classified under Industrial Activities.
The sub-consolidation of Industrial Activities also includes companies that provide centralized treasury services for Fiat excluding Chrysler
(i.e., raising funds in the market and financing Group companies, with the exception of Chrysler Group LLC and its subsidiaries). Those
activities do not, however, include offering financing to third parties.
N.B.: All Chrysler Group activities are included under Industrial Activities and Chrysler Group’s treasury activities (including funding and cash
management) are managed separately from the rest of Fiat Group.