Chrysler 2013 Annual Report Download - page 133
Download and view the complete annual report
Please find page 133 of the 2013 Chrysler annual report below. You can navigate through the pages in the report by either clicking on the pages listed below, or by using the keyword search tool below to find specific information within the annual report.-
 1
1 -
2
-
3
-
4
-
5
-
6
-
7
-
8
-
9
-
10
-
11
-
12
-
13
-
14
-
15
-
16
-
17
-
18
-
19
-
20
-
21
-
22
-
23
-
24
-
25
-
26
-
27
-
28
-
29
-
30
-
31
-
32
-
33
-
34
-
35
-
36
-
37
-
38
-
39
-
40
-
41
-
42
-
43
-
44
-
45
-
46
-
47
-
48
-
49
-
50
-
51
-
52
-
53
-
54
-
55
-
56
-
57
-
58
-
59
-
60
-
61
-
62
-
63
-
64
-
65
-
66
-
67
-
68
-
69
-
70
-
71
-
72
-
73
-
74
-
75
-
76
-
77
-
78
-
79
-
80
-
81
-
82
-
83
-
84
-
85
-
86
-
87
-
88
-
89
-
90
-
91
-
92
-
93
-
94
-
95
-
96
-
97
-
98
-
99
-
100
-
101
-
102
-
103
-
104
-
105
-
106
-
107
-
108
-
109
-
110
-
111
-
112
-
113
-
114
-
115
-
116
-
117
-
118
-
119
-
120
-
121
-
122
-
 123
123 -
 124
124 -
 125
125 -
 126
126 -
 127
127 -
 128
128 -
 129
129 -
 130
130 -
 131
131 -
 132
132 -
 133
133 -
 134
134 -
 135
135 -
 136
136 -
 137
137 -
 138
138 -
 139
139 -
 140
140 -
 141
141 -
 142
142 -
 143
143 -
144
-
145
-
146
-
147
-
148
-
149
-
150
-
151
-
152
-
153
-
154
-
155
-
156
-
157
-
158
-
159
-
160
-
161
-
162
-
163
-
164
-
165
-
166
-
167
-
168
-
169
-
170
-
171
-
172
-
173
-
174
-
175
-
176
-
177
-
178
-
179
-
180
-
181
-
182
-
183
-
184
-
185
-
186
-
187
-
188
-
189
-
190
-
191
-
192
-
193
-
194
-
195
-
196
-
197
-
198
-
199
-
200
-
201
-
202
-
203
-
204
-
205
-
206
-
207
-
208
-
209
-
210
-
211
-
212
-
213
-
214
-
215
-
216
-
217
-
218
-
219
-
220
-
221
-
222
-
223
-
224
-
225
-
226
-
227
-
228
-
229
-
230
-
231
-
232
-
233
-
234
-
235
-
236
-
237
-
238
-
239
-
240
-
241
-
242
-
243
-
244
-
245
-
246
-
247
-
248
-
249
-
250
-
251
-
252
-
253
-
254
-
255
-
256
-
257
-
258
-
259
-
260
-
261
-
262
-
263
-
264
-
265
-
266
-
267
-
268
-
269
-
270
-
271
-
272
-
273
-
274
-
275
-
276
-
277
-
278
-
279
-
280
-
281
-
282
-
283
-
284
-
285
-
286
-
287
-
288
-
289
-
290
-
291
-
292
-
293
-
294
-
295
-
296
-
297
-
298
-
299
-
300
-
301
-
302
-
303
-
304
-
305
-
306
-
307
-
308
-
309
-
310
-
311
-
312
-
313
-
314
-
315
-
316
-
317
-
318
-
319
-
320
-
321
-
322
-
323
-
324
-
325
-
326
-
327
-
328
-
329
-
330
-
331
-
332
-
333
-
334
-
335
-
336
-
337
-
338
-
339
-
340
-
341
-
342
-
343
-
344
-
345
-
346
-
347
-
348
-
349
-
350
-
351
-
352
-
353
-
354
-
355
-
356
-
357
-
358
-
359
-
360
-
361
-
362
-
363
-
364
-
365
-
366
 |
 |

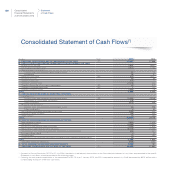
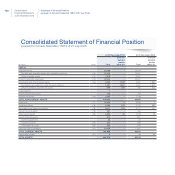
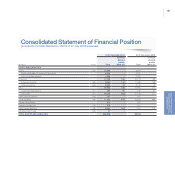
132 Consolidated
Financial Statements
at 31 December 2013
Statement of Cash Flows pursuant to
Consob Resolution 15519 of 27 July 2006
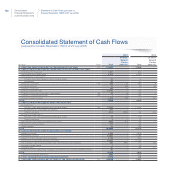
Consolidated Statement of Cash Flows
pursuant to Consob Resolution 15519 of 27 July 2006
2013 2012
(€ million) Note Total
of which
Related
Parties
(Note 31) Total
of which
Related
Parties
(Note 31)
A) CASH AND CASH EQUIVALENTS AT BEGINNING OF THE YEAR (21) 17,657 17,526
B) CASH FLOWS FROM/(USED IN) OPERATING ACTIVITIES DURING THE YEAR:
Profit/(loss) for the period 1,951 896
Amortization and depreciation 4,574 4,134
(Gains)/losses on disposal of:
Property, plant and equipment and intangible assets 31 14
Investments (8) 91
Other non-cash items (32) 522 6 562 9
Dividends received 92 92 89 89
Change in provisions 444 1 77 1
Change in deferred taxes (1,578) - (72) -
Change in items due to buy-back commitments (32) 92 2 (51) 2
Change in operating lease items (32) 1 - (10) -
Change in working capital 1,468 79 714 (90)
TOTAL 7,589 6,444
C) CASH FLOWS FROM/(USED IN) INVESTING ACTIVITIES:
Investments in:
Property, plant and equipment and intangible assets (32) (7,440) - (7,534) -
Investments in consolidated subsidiaries (19) - - -
Other investments (212) (211) (24) (20)
Proceeds from the sale of:
Property, plant and equipment and intangible assets 43 - 118 -
Other investments 5 - 21 -
Net change in receivables from financing activities (449) 17 (24) (7)
Change in current securities (10) - (64) -
Other changes (4) - (30) -
TOTAL (8,086) (7,537)
D) CASH FLOWS FROM/(USED IN) FINANCING ACTIVITIES:
Issuance of bonds 2,866 - 2,535 -
Repayment of bonds (1,000) - (1,450) -
Issuance of other medium-term borrowings 3,188 - 1,925 -
Repayment of other medium-term borrowings (2,549) - (1,528) -
Net change in other financial payables and other financial assets/liabilities 686 191 197 (34)
Increase in share capital 4 - 22 -
Dividends paid (1) - (58) (11)
Distribution for tax withholding obligations on behalf of non-controlling interests (“NCI”) (6) - - -
TOTAL 3,188 1,643
Translation exchange differences (909) (419)
E) TOTAL CHANGE IN CASH AND CASH EQUIVALENTS 1,782 131
F) CASH AND CASH EQUIVALENTS AT END OF THE YEAR AS REPORTED (21) 19,439 17,657