Chrysler 2013 Annual Report Download - page 227
Download and view the complete annual report
Please find page 227 of the 2013 Chrysler annual report below. You can navigate through the pages in the report by either clicking on the pages listed below, or by using the keyword search tool below to find specific information within the annual report.-
 1
1 -
2
-
3
-
4
-
5
-
6
-
7
-
8
-
9
-
10
-
11
-
12
-
13
-
14
-
15
-
16
-
17
-
18
-
19
-
20
-
21
-
22
-
23
-
24
-
25
-
26
-
27
-
28
-
29
-
30
-
31
-
32
-
33
-
34
-
35
-
36
-
37
-
38
-
39
-
40
-
41
-
42
-
43
-
44
-
45
-
46
-
47
-
48
-
49
-
50
-
51
-
52
-
53
-
54
-
55
-
56
-
57
-
58
-
59
-
60
-
61
-
62
-
63
-
64
-
65
-
66
-
67
-
68
-
69
-
70
-
71
-
72
-
73
-
74
-
75
-
76
-
77
-
78
-
79
-
80
-
81
-
82
-
83
-
84
-
85
-
86
-
87
-
88
-
89
-
90
-
91
-
92
-
93
-
94
-
95
-
96
-
97
-
98
-
99
-
100
-
101
-
102
-
103
-
104
-
105
-
106
-
107
-
108
-
109
-
110
-
111
-
112
-
113
-
114
-
115
-
116
-
117
-
118
-
119
-
120
-
121
-
122
-
123
-
124
-
125
-
126
-
127
-
128
-
129
-
130
-
131
-
132
-
133
-
134
-
135
-
136
-
137
-
138
-
139
-
140
-
141
-
142
-
143
-
144
-
145
-
146
-
147
-
148
-
149
-
150
-
151
-
152
-
153
-
154
-
155
-
156
-
157
-
158
-
159
-
160
-
161
-
162
-
163
-
164
-
165
-
166
-
167
-
168
-
169
-
170
-
171
-
172
-
173
-
174
-
175
-
176
-
177
-
178
-
179
-
180
-
181
-
182
-
183
-
184
-
185
-
186
-
187
-
188
-
189
-
190
-
191
-
192
-
193
-
194
-
195
-
196
-
197
-
198
-
199
-
200
-
201
-
202
-
203
-
204
-
205
-
206
-
207
-
208
-
209
-
210
-
211
-
212
-
213
-
214
-
215
-
216
-
 217
217 -
 218
218 -
 219
219 -
 220
220 -
 221
221 -
 222
222 -
 223
223 -
 224
224 -
 225
225 -
 226
226 -
 227
227 -
 228
228 -
 229
229 -
 230
230 -
 231
231 -
 232
232 -
 233
233 -
 234
234 -
 235
235 -
 236
236 -
 237
237 -
238
-
239
-
240
-
241
-
242
-
243
-
244
-
245
-
246
-
247
-
248
-
249
-
250
-
251
-
252
-
253
-
254
-
255
-
256
-
257
-
258
-
259
-
260
-
261
-
262
-
263
-
264
-
265
-
266
-
267
-
268
-
269
-
270
-
271
-
272
-
273
-
274
-
275
-
276
-
277
-
278
-
279
-
280
-
281
-
282
-
283
-
284
-
285
-
286
-
287
-
288
-
289
-
290
-
291
-
292
-
293
-
294
-
295
-
296
-
297
-
298
-
299
-
300
-
301
-
302
-
303
-
304
-
305
-
306
-
307
-
308
-
309
-
310
-
311
-
312
-
313
-
314
-
315
-
316
-
317
-
318
-
319
-
320
-
321
-
322
-
323
-
324
-
325
-
326
-
327
-
328
-
329
-
330
-
331
-
332
-
333
-
334
-
335
-
336
-
337
-
338
-
339
-
340
-
341
-
342
-
343
-
344
-
345
-
346
-
347
-
348
-
349
-
350
-
351
-
352
-
353
-
354
-
355
-
356
-
357
-
358
-
359
-
360
-
361
-
362
-
363
-
364
-
365
-
366
 |
 |

226 Consolidated
Financial Statements
at 31 December 2013
Notes
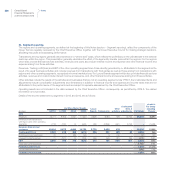
34. Segment reporting
The regions and operating segments, as defined at the beginning of this Notes (section – Segment reporting), reflect the components of the
Group that are regularly reviewed by the Chief Executive Officer together with the Group Executive Council for making strategic decisions,
allocating resources and assessing performance.
Transactions among regions generally are presented on a “where-sold” basis, which reflects the profit/(loss) on the ultimate sale to the external
customer within the region. This presentation generally eliminates the effect of the legal entity transfer price within the regions. For the regions
which also provide financial services activities, revenues and costs also include interest income and expense and other financial income and
expense arising from those activities.
Revenues, Trading profit/(loss) and EBIT of the other operating segments are those directly generated by or attributable to the segment as the
result of its usual business activities and include revenues from transactions with third parties as well as those arising from transactions with
regions and other operating segments, recognized at normal market prices. For Luxury Brands segment which also provides financial services
activities, revenues and costs include interest income and expense, and other financial income and expense arising from those activities.
Other activities include the results of the activities and businesses that are not an operating segment under IFRS 8, the Unallocated items and
adjustments include consolidation adjustments and eliminations in addition to financial income and expense and income taxes that are not
attributable to the performance of the segments and are subject to separate assessment by the Chief Executive Officer.
Operating assets are not included in the data reviewed by the Chief Executive Officer, consequently, as permitted by IFRS 8, the related
information is not provided.
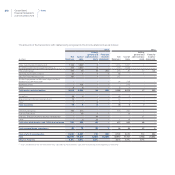
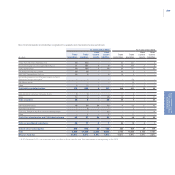
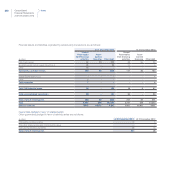
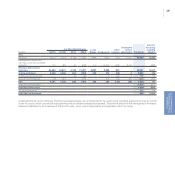
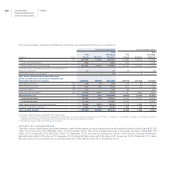
Details of the Income statement by segments in 2013 and 2012 are as follows:
Car Mass-Market brands Luxury Other
Unallocated
items &
of which:
Fiat Group
excluding
(€ million) NAFTA LATAM APAC EMEA Brands Components activities adjustments Fiat Group Chrysler
2013
Revenues 45,777 9,973 4,621 17,420 3,809 8,080 929 (3,793) 86,816 35,593
Revenues from transactions
with regions and other operating
segments (173) (100) (1) (640) (33) (2,395) (451) 3,793 -(1,635)
Revenues from external
customers 45,604 9,873 4,620 16,780 3,776 5,685 478 - 86,816 33,958
Trading profit/(loss) 2,220 619 358 (470) 535 201 (67) (2) 3,394 246
Profit/(loss) from investments (1) - (39) 145 - 5 (13) - 97 103
Unusual income/(expense) 71 (127) (1) (195) (65) (60) (87) (55) (519) (537)
EBIT 2,290 492 318 (520) 470 146 (167) (57) 2,972 (188)
Financial income/(expense) (1,964) (989)
Profit/(loss) before taxes 1,008 (1,177)
Tax (income)/expenses (943) (736)
Profit/(loss) for the period 1,951 (441)