Chrysler 2013 Annual Report Download - page 217
Download and view the complete annual report
Please find page 217 of the 2013 Chrysler annual report below. You can navigate through the pages in the report by either clicking on the pages listed below, or by using the keyword search tool below to find specific information within the annual report.-
 1
1 -
2
-
3
-
4
-
5
-
6
-
7
-
8
-
9
-
10
-
11
-
12
-
13
-
14
-
15
-
16
-
17
-
18
-
19
-
20
-
21
-
22
-
23
-
24
-
25
-
26
-
27
-
28
-
29
-
30
-
31
-
32
-
33
-
34
-
35
-
36
-
37
-
38
-
39
-
40
-
41
-
42
-
43
-
44
-
45
-
46
-
47
-
48
-
49
-
50
-
51
-
52
-
53
-
54
-
55
-
56
-
57
-
58
-
59
-
60
-
61
-
62
-
63
-
64
-
65
-
66
-
67
-
68
-
69
-
70
-
71
-
72
-
73
-
74
-
75
-
76
-
77
-
78
-
79
-
80
-
81
-
82
-
83
-
84
-
85
-
86
-
87
-
88
-
89
-
90
-
91
-
92
-
93
-
94
-
95
-
96
-
97
-
98
-
99
-
100
-
101
-
102
-
103
-
104
-
105
-
106
-
107
-
108
-
109
-
110
-
111
-
112
-
113
-
114
-
115
-
116
-
117
-
118
-
119
-
120
-
121
-
122
-
123
-
124
-
125
-
126
-
127
-
128
-
129
-
130
-
131
-
132
-
133
-
134
-
135
-
136
-
137
-
138
-
139
-
140
-
141
-
142
-
143
-
144
-
145
-
146
-
147
-
148
-
149
-
150
-
151
-
152
-
153
-
154
-
155
-
156
-
157
-
158
-
159
-
160
-
161
-
162
-
163
-
164
-
165
-
166
-
167
-
168
-
169
-
170
-
171
-
172
-
173
-
174
-
175
-
176
-
177
-
178
-
179
-
180
-
181
-
182
-
183
-
184
-
185
-
186
-
187
-
188
-
189
-
190
-
191
-
192
-
193
-
194
-
195
-
196
-
197
-
198
-
199
-
200
-
201
-
202
-
203
-
204
-
205
-
206
-
 207
207 -
 208
208 -
 209
209 -
 210
210 -
 211
211 -
 212
212 -
 213
213 -
 214
214 -
 215
215 -
 216
216 -
 217
217 -
 218
218 -
 219
219 -
 220
220 -
 221
221 -
 222
222 -
 223
223 -
 224
224 -
 225
225 -
 226
226 -
 227
227 -
228
-
229
-
230
-
231
-
232
-
233
-
234
-
235
-
236
-
237
-
238
-
239
-
240
-
241
-
242
-
243
-
244
-
245
-
246
-
247
-
248
-
249
-
250
-
251
-
252
-
253
-
254
-
255
-
256
-
257
-
258
-
259
-
260
-
261
-
262
-
263
-
264
-
265
-
266
-
267
-
268
-
269
-
270
-
271
-
272
-
273
-
274
-
275
-
276
-
277
-
278
-
279
-
280
-
281
-
282
-
283
-
284
-
285
-
286
-
287
-
288
-
289
-
290
-
291
-
292
-
293
-
294
-
295
-
296
-
297
-
298
-
299
-
300
-
301
-
302
-
303
-
304
-
305
-
306
-
307
-
308
-
309
-
310
-
311
-
312
-
313
-
314
-
315
-
316
-
317
-
318
-
319
-
320
-
321
-
322
-
323
-
324
-
325
-
326
-
327
-
328
-
329
-
330
-
331
-
332
-
333
-
334
-
335
-
336
-
337
-
338
-
339
-
340
-
341
-
342
-
343
-
344
-
345
-
346
-
347
-
348
-
349
-
350
-
351
-
352
-
353
-
354
-
355
-
356
-
357
-
358
-
359
-
360
-
361
-
362
-
363
-
364
-
365
-
366
 |
 |
216 Consolidated
Financial Statements
at 31 December 2013
Notes
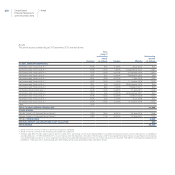
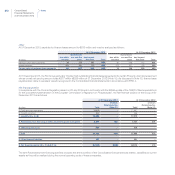
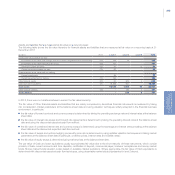
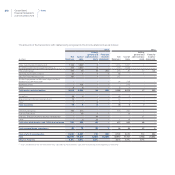
The following table provides a reconciliation from the opening balances to the closing balances for fair value measurements categorized in
Level 3 in 2013:
(€ million)
Other non-current
securities
Other financial
assets/(liabilities)
At 31 December 2012 12 7
(Gains)/Losses recognized in Income statement - 6
Gains/(Losses) recognized in Other comprehensive income/losses - (3)
Issues/Settlements - (8)
At 31 December 2013 12 2
The gains/losses included in the Income statement are recognized in Cost of sales for €6 million. The gains and losses recognized in Other
comprehensive income/(losses) have been included in Gains/(losses) on cash flow hedging instruments for €2 million and in Exchange
differences on translating foreign operations for €1 million (see Note 23).
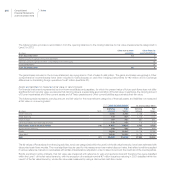
Assets and liabilities not measured at fair value on recurring basis
For financial instruments represented by short-term receivables and payables, for which the present value of future cash flows does not differ
significantly from carrying value, we assume that carrying value is a reasonable approximation of the fair value. In particular, the carrying amount
of Current receivables and Other current assets and of Trade payables and Other current liabilities approximates their fair value.
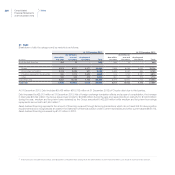
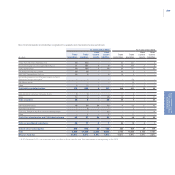
The following table represents carrying amount and fair value for the most relevant categories of financial assets and liabilities not measured
at fair value on a recurring basis:
At 31 December 2013 At 31 December 2012
(€ million) Note
Carrying
amount
Fair
Value
Carrying
amount
Fair
Value
Dealer financing 2,286 2,290 2,108 2,108
Retail financing 970 957 1,115 1,112
Finance lease 297 296 331 331
Other receivables from financing activities 118 118 173 173
Receivables from financing activities (18) 3,671 3,661 3,727 3,724
Asset backed financing 596 596 449 449
Bonds 14,466 15,464 12,716 13,164
Other debt 14,840 14,952 14,724 14,747
Debt (27) 29,902 31,012 27,889 28,360
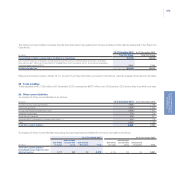
The fair values of Receivables from financing activities, which are categorized within the Level 3 of the fair value hierarchy, have been estimated with
discounted cash flows models. The most significant inputs used for this measurement are market discount rates, that reflect conditions applied
in various reference markets on receivables with similar characteristics, adjusted in order to take into account the credit risk of the counterparties.
Bonds are listed in active markets, their fair value was measured with reference to year-end quoted prices and therefore they were classified
within the Level 1 of the fair value hierarchy, with the exception of a residual nominal €7 million issuance maturing in 2021 classified within the
Level 2 of the fair value hierarchy, whose fair value was measured by using a discounted cash flow model.