Chrysler 2013 Annual Report Download - page 138
Download and view the complete annual report
Please find page 138 of the 2013 Chrysler annual report below. You can navigate through the pages in the report by either clicking on the pages listed below, or by using the keyword search tool below to find specific information within the annual report.-
 1
1 -
2
-
3
-
4
-
5
-
6
-
7
-
8
-
9
-
10
-
11
-
12
-
13
-
14
-
15
-
16
-
17
-
18
-
19
-
20
-
21
-
22
-
23
-
24
-
25
-
26
-
27
-
28
-
29
-
30
-
31
-
32
-
33
-
34
-
35
-
36
-
37
-
38
-
39
-
40
-
41
-
42
-
43
-
44
-
45
-
46
-
47
-
48
-
49
-
50
-
51
-
52
-
53
-
54
-
55
-
56
-
57
-
58
-
59
-
60
-
61
-
62
-
63
-
64
-
65
-
66
-
67
-
68
-
69
-
70
-
71
-
72
-
73
-
74
-
75
-
76
-
77
-
78
-
79
-
80
-
81
-
82
-
83
-
84
-
85
-
86
-
87
-
88
-
89
-
90
-
91
-
92
-
93
-
94
-
95
-
96
-
97
-
98
-
99
-
100
-
101
-
102
-
103
-
104
-
105
-
106
-
107
-
108
-
109
-
110
-
111
-
112
-
113
-
114
-
115
-
116
-
117
-
118
-
119
-
120
-
121
-
122
-
123
-
124
-
125
-
126
-
127
-
 128
128 -
 129
129 -
 130
130 -
 131
131 -
 132
132 -
 133
133 -
 134
134 -
 135
135 -
 136
136 -
 137
137 -
 138
138 -
 139
139 -
 140
140 -
 141
141 -
 142
142 -
 143
143 -
 144
144 -
 145
145 -
 146
146 -
 147
147 -
 148
148 -
149
-
150
-
151
-
152
-
153
-
154
-
155
-
156
-
157
-
158
-
159
-
160
-
161
-
162
-
163
-
164
-
165
-
166
-
167
-
168
-
169
-
170
-
171
-
172
-
173
-
174
-
175
-
176
-
177
-
178
-
179
-
180
-
181
-
182
-
183
-
184
-
185
-
186
-
187
-
188
-
189
-
190
-
191
-
192
-
193
-
194
-
195
-
196
-
197
-
198
-
199
-
200
-
201
-
202
-
203
-
204
-
205
-
206
-
207
-
208
-
209
-
210
-
211
-
212
-
213
-
214
-
215
-
216
-
217
-
218
-
219
-
220
-
221
-
222
-
223
-
224
-
225
-
226
-
227
-
228
-
229
-
230
-
231
-
232
-
233
-
234
-
235
-
236
-
237
-
238
-
239
-
240
-
241
-
242
-
243
-
244
-
245
-
246
-
247
-
248
-
249
-
250
-
251
-
252
-
253
-
254
-
255
-
256
-
257
-
258
-
259
-
260
-
261
-
262
-
263
-
264
-
265
-
266
-
267
-
268
-
269
-
270
-
271
-
272
-
273
-
274
-
275
-
276
-
277
-
278
-
279
-
280
-
281
-
282
-
283
-
284
-
285
-
286
-
287
-
288
-
289
-
290
-
291
-
292
-
293
-
294
-
295
-
296
-
297
-
298
-
299
-
300
-
301
-
302
-
303
-
304
-
305
-
306
-
307
-
308
-
309
-
310
-
311
-
312
-
313
-
314
-
315
-
316
-
317
-
318
-
319
-
320
-
321
-
322
-
323
-
324
-
325
-
326
-
327
-
328
-
329
-
330
-
331
-
332
-
333
-
334
-
335
-
336
-
337
-
338
-
339
-
340
-
341
-
342
-
343
-
344
-
345
-
346
-
347
-
348
-
349
-
350
-
351
-
352
-
353
-
354
-
355
-
356
-
357
-
358
-
359
-
360
-
361
-
362
-
363
-
364
-
365
-
366
 |
 |

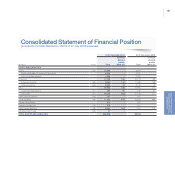
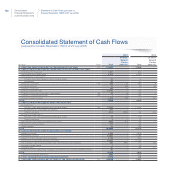
137
Consolidated
Financial Statements
at 31 December 2013
Development costs
Development costs for vehicle project production and related components, engines and production systems are recognized as an asset if and
only if both of the following conditions under IAS 38 – Intangible assets are met: that development costs can be measured reliably and that
the technical feasibility of the product, volumes and pricing support the view that the development expenditure will generate future economic
benefits. Capitalized development costs include all direct and indirect costs that may be directly attributed to the development process.
Capitalized development costs are amortized on a straight-line basis from the start of production over the expected life cycle of the models
(generally 5-6 years) or powertrains developed (generally 10-12 years).
All other development costs are expensed as incurred.
Intangible assets with indefinite useful lives
Intangible assets with indefinite useful lives consist principally of brands which have no legal, contractual, competitive, economic, or other
factors that limit their useful lives. Intangible assets with indefinite useful lives are not amortized, but are tested for impairment annually or more
frequently whenever there is an indication that the asset may be impaired, by comparing the carrying amount with the recoverable amount.
Property, plant and equipment
Cost
Property, plant and equipment are initially recognized at cost which comprises the purchase price, any costs directly attributable to bringing
the assets to the location and condition necessary for it to be capable of operating in the manner intended by management and any initial
estimate of the costs of dismantling and removing the item and restoring the site on which it is located. The self-constructed assets are initially
recognized at production cost. Subsequent expenditures and the cost of replacing parts of an asset are capitalized only if they increase
the future economic benefits embodied in that asset. All other expenditures are expensed as incurred. When such replacement costs are
capitalized, the carrying amount of the parts that are replaced is recognized in the Income statement.
Assets held under finance leases, which provide the Group with substantially all the risks and rewards of ownership, are recognized as assets
of the Group at their fair value or, if lower, at the present value of the minimum lease payments. The corresponding liability to the lessor is
included in the financial statements as a Debt. The assets are depreciated by the method and at the rates indicated below depending on the
nature of the leased assets.
Leases under which the lessor retains substantially all the risks and rewards of ownership of the leased assets are classified as operating leases.
Operating lease expenditures are expensed on a straight-line basis over the lease terms.
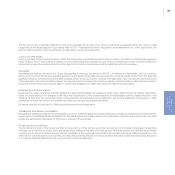
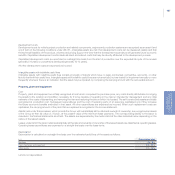
Depreciation
Depreciation is calculated on a straight-line basis over the estimated useful lives of the assets as follows:
In % Depreciation rates
Buildings 3% - 8%
Plant, machinery and equipment 3% - 33%
Other assets 5% - 33%
Land is not depreciated.