Chrysler 2013 Annual Report Download - page 44
Download and view the complete annual report
Please find page 44 of the 2013 Chrysler annual report below. You can navigate through the pages in the report by either clicking on the pages listed below, or by using the keyword search tool below to find specific information within the annual report.-
 1
1 -
2
-
3
-
4
-
5
-
6
-
7
-
8
-
9
-
10
-
11
-
12
-
13
-
14
-
15
-
16
-
17
-
18
-
19
-
20
-
21
-
22
-
23
-
24
-
25
-
26
-
27
-
28
-
29
-
30
-
31
-
32
-
33
-
 34
34 -
 35
35 -
 36
36 -
 37
37 -
 38
38 -
 39
39 -
 40
40 -
 41
41 -
 42
42 -
 43
43 -
 44
44 -
 45
45 -
 46
46 -
 47
47 -
 48
48 -
 49
49 -
 50
50 -
 51
51 -
 52
52 -
 53
53 -
 54
54 -
55
-
56
-
57
-
58
-
59
-
60
-
61
-
62
-
63
-
64
-
65
-
66
-
67
-
68
-
69
-
70
-
71
-
72
-
73
-
74
-
75
-
76
-
77
-
78
-
79
-
80
-
81
-
82
-
83
-
84
-
85
-
86
-
87
-
88
-
89
-
90
-
91
-
92
-
93
-
94
-
95
-
96
-
97
-
98
-
99
-
100
-
101
-
102
-
103
-
104
-
105
-
106
-
107
-
108
-
109
-
110
-
111
-
112
-
113
-
114
-
115
-
116
-
117
-
118
-
119
-
120
-
121
-
122
-
123
-
124
-
125
-
126
-
127
-
128
-
129
-
130
-
131
-
132
-
133
-
134
-
135
-
136
-
137
-
138
-
139
-
140
-
141
-
142
-
143
-
144
-
145
-
146
-
147
-
148
-
149
-
150
-
151
-
152
-
153
-
154
-
155
-
156
-
157
-
158
-
159
-
160
-
161
-
162
-
163
-
164
-
165
-
166
-
167
-
168
-
169
-
170
-
171
-
172
-
173
-
174
-
175
-
176
-
177
-
178
-
179
-
180
-
181
-
182
-
183
-
184
-
185
-
186
-
187
-
188
-
189
-
190
-
191
-
192
-
193
-
194
-
195
-
196
-
197
-
198
-
199
-
200
-
201
-
202
-
203
-
204
-
205
-
206
-
207
-
208
-
209
-
210
-
211
-
212
-
213
-
214
-
215
-
216
-
217
-
218
-
219
-
220
-
221
-
222
-
223
-
224
-
225
-
226
-
227
-
228
-
229
-
230
-
231
-
232
-
233
-
234
-
235
-
236
-
237
-
238
-
239
-
240
-
241
-
242
-
243
-
244
-
245
-
246
-
247
-
248
-
249
-
250
-
251
-
252
-
253
-
254
-
255
-
256
-
257
-
258
-
259
-
260
-
261
-
262
-
263
-
264
-
265
-
266
-
267
-
268
-
269
-
270
-
271
-
272
-
273
-
274
-
275
-
276
-
277
-
278
-
279
-
280
-
281
-
282
-
283
-
284
-
285
-
286
-
287
-
288
-
289
-
290
-
291
-
292
-
293
-
294
-
295
-
296
-
297
-
298
-
299
-
300
-
301
-
302
-
303
-
304
-
305
-
306
-
307
-
308
-
309
-
310
-
311
-
312
-
313
-
314
-
315
-
316
-
317
-
318
-
319
-
320
-
321
-
322
-
323
-
324
-
325
-
326
-
327
-
328
-
329
-
330
-
331
-
332
-
333
-
334
-
335
-
336
-
337
-
338
-
339
-
340
-
341
-
342
-
343
-
344
-
345
-
346
-
347
-
348
-
349
-
350
-
351
-
352
-
353
-
354
-
355
-
356
-
357
-
358
-
359
-
360
-
361
-
362
-
363
-
364
-
365
-
366
 |
 |
43
Report on
Operations
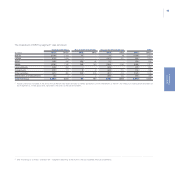
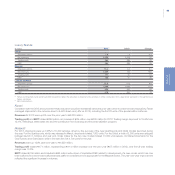
Operating Performance
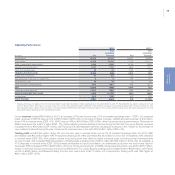
2013 2012(*)
(€ million) Fiat
Fiat
excluding
Chrysler Fiat
Fiat
excluding
Chrysler
Net revenues 86,816 35,593 83,957 35,566
Cost of sales 74,570 31,324 71,701 31,117
Selling, general and administrative 6,689 2,896 6,763 2,998
Research and development 2,231 1,151 1,850 1,037
Other income/(expense) 68 24 (102) (76)
TRADING PROFIT/(LOSS) 3,394 246 3,541 338
Result from investments 97 103 107 110
Gains/(losses) on disposal of investments 8 8 (91) (91)
Restructuring costs 28 38 15 63
Other unusual income/(expense) (499) (507) (138) (107)
EBIT 2,972 (188) 3,404 187
Financial income/(expense) (1,964) (989) (1,885) (817)
PROFIT/(LOSS) BEFORE TAXES 1,008 (1,177) 1,519 (630)
Income taxes (943) (736) 623 418
PROFIT/(LOSS) 1,951 (441) 896 (1,048)
(*) Figures previously included in the 2012 Annual Report have been restated to reflect application of the amendment to IAS 19. Restatement resulted in a reduction in net
profit of €515 million (€7 million increase in net loss for Fiat excluding Chrysler), reflecting a €273 million increase in operating expense (€17 million increase for Fiat
excluding Chrysler), a €244 million increase in financial expense (€8 million decrease in financial expense for Fiat excluding Chrysler) and a €2 million decrease in income
taxes (€2 million decrease for Fiat excluding Chrysler).
Group revenues totaled €86.8 billion in 2013, an increase of 3% over the prior year (+7% at constant exchange rates – “CER”). On a regional
basis, revenues in NAFTA were up 5% to €45.8 billion (CER +9%) on the back of higher volumes. LATAM reported revenues of €10 billion,
down 10% in nominal terms (CER +1%). APAC was up 48% to €4.6 billion (CER +54%), driven by strong volume performance. Revenues for
EMEA were down 2% to €17.4 billion (CER -1%), mainly reflecting volume declines in Europe during the first half. For Luxury Brands, revenues
increased 31% to €3.8 billion (CER +34%), with Ferrari up 5% and Maserati more than doubling its revenues to €1.7 billion on the strength of
new models introduced during the year. Components revenues were in line with 2012 at €8.1 billion (CER +4%).
Trading profit was €3,394 million, down 4% over the prior year in nominal terms, but up 1% at constant exchange rates. For 2013, R&D
amortization was €0.3 billion higher. NAFTA reported a trading profit of €2,220 million (€2,443 million for 2012, IAS 19 restated), a 9% decrease
in nominal terms (CER -6%), with positive volume and pricing more than offset by higher industrial costs, including content enhancements
for new models, and increased R&D amortization. LATAM posted a trading profit of €619 million (€1,056 million in 2012, IAS 19 restated), a
41% decrease in nominal terms (CER -33%) primarily attributable to input cost inflation, an unfavorable production mix and a lower result in
Venezuela. APAC increased 38% to €358 million, driven by strong volume growth. In EMEA, losses were reduced by one-third to €470 million,
mainly on the back of improved product mix and cost efficiencies. For Luxury Brands, trading profit increased 36% to €535 million, with Ferrari
up 9% to €364 million, and Maserati tripling from the prior year’s level to €171 million. For Components, trading profit was 16% higher at
€201 million (CER +21%).