Chrysler 2013 Annual Report Download - page 63
Download and view the complete annual report
Please find page 63 of the 2013 Chrysler annual report below. You can navigate through the pages in the report by either clicking on the pages listed below, or by using the keyword search tool below to find specific information within the annual report.-
 1
1 -
2
-
3
-
4
-
5
-
6
-
7
-
8
-
9
-
10
-
11
-
12
-
13
-
14
-
15
-
16
-
17
-
18
-
19
-
20
-
21
-
22
-
23
-
24
-
25
-
26
-
27
-
28
-
29
-
30
-
31
-
32
-
33
-
34
-
35
-
36
-
37
-
38
-
39
-
40
-
41
-
42
-
43
-
44
-
45
-
46
-
47
-
48
-
49
-
50
-
51
-
52
-
 53
53 -
 54
54 -
 55
55 -
 56
56 -
 57
57 -
 58
58 -
 59
59 -
 60
60 -
 61
61 -
 62
62 -
 63
63 -
 64
64 -
 65
65 -
 66
66 -
 67
67 -
 68
68 -
 69
69 -
 70
70 -
 71
71 -
 72
72 -
 73
73 -
74
-
75
-
76
-
77
-
78
-
79
-
80
-
81
-
82
-
83
-
84
-
85
-
86
-
87
-
88
-
89
-
90
-
91
-
92
-
93
-
94
-
95
-
96
-
97
-
98
-
99
-
100
-
101
-
102
-
103
-
104
-
105
-
106
-
107
-
108
-
109
-
110
-
111
-
112
-
113
-
114
-
115
-
116
-
117
-
118
-
119
-
120
-
121
-
122
-
123
-
124
-
125
-
126
-
127
-
128
-
129
-
130
-
131
-
132
-
133
-
134
-
135
-
136
-
137
-
138
-
139
-
140
-
141
-
142
-
143
-
144
-
145
-
146
-
147
-
148
-
149
-
150
-
151
-
152
-
153
-
154
-
155
-
156
-
157
-
158
-
159
-
160
-
161
-
162
-
163
-
164
-
165
-
166
-
167
-
168
-
169
-
170
-
171
-
172
-
173
-
174
-
175
-
176
-
177
-
178
-
179
-
180
-
181
-
182
-
183
-
184
-
185
-
186
-
187
-
188
-
189
-
190
-
191
-
192
-
193
-
194
-
195
-
196
-
197
-
198
-
199
-
200
-
201
-
202
-
203
-
204
-
205
-
206
-
207
-
208
-
209
-
210
-
211
-
212
-
213
-
214
-
215
-
216
-
217
-
218
-
219
-
220
-
221
-
222
-
223
-
224
-
225
-
226
-
227
-
228
-
229
-
230
-
231
-
232
-
233
-
234
-
235
-
236
-
237
-
238
-
239
-
240
-
241
-
242
-
243
-
244
-
245
-
246
-
247
-
248
-
249
-
250
-
251
-
252
-
253
-
254
-
255
-
256
-
257
-
258
-
259
-
260
-
261
-
262
-
263
-
264
-
265
-
266
-
267
-
268
-
269
-
270
-
271
-
272
-
273
-
274
-
275
-
276
-
277
-
278
-
279
-
280
-
281
-
282
-
283
-
284
-
285
-
286
-
287
-
288
-
289
-
290
-
291
-
292
-
293
-
294
-
295
-
296
-
297
-
298
-
299
-
300
-
301
-
302
-
303
-
304
-
305
-
306
-
307
-
308
-
309
-
310
-
311
-
312
-
313
-
314
-
315
-
316
-
317
-
318
-
319
-
320
-
321
-
322
-
323
-
324
-
325
-
326
-
327
-
328
-
329
-
330
-
331
-
332
-
333
-
334
-
335
-
336
-
337
-
338
-
339
-
340
-
341
-
342
-
343
-
344
-
345
-
346
-
347
-
348
-
349
-
350
-
351
-
352
-
353
-
354
-
355
-
356
-
357
-
358
-
359
-
360
-
361
-
362
-
363
-
364
-
365
-
366
 |
 |

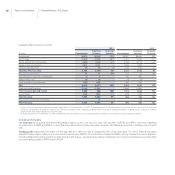
62 Report on Operations
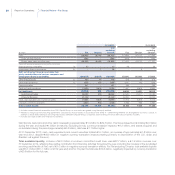
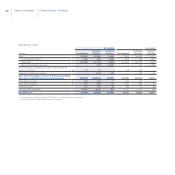
Change in Net Industrial Debt(1)
2013 2012(*)
(€ million) Fiat Chrysler
Fiat
excluding
Chrysler Fiat Chrysler
Fiat
excluding
Chrysler
Net industrial debt at beginning of year (6,545) (1,497) (5,048) (5,529) (3,080) (2,449)
Profit/(loss) 1,951 2,392 (441) 896 1,944 (1,048)
Depreciation and amortization 4,572 2,273 2,299 4,132 2,017 2,115
Changes in provisions and other changes (475) 204 (679) 617 653 (36)
Cash from/(used in) operating activities before change
in working capital 6,048 4,869 1,179 5,645 4,614 1,031
Change in working capital 1,464 335 1,129 694 1,275 (581)
Cash from/(used in) operating activities 7,512 5,204 2,308 6,339 5,889 450
Investments in property, plant and equipment and intangible assets (7,433) (3,573) (3,860) (7,530) (4,311) (3,219)
Cash from/(used in) operating activities, net of capital expenditure 79 1,631 (1,552) (1,191) 1,578 (2,769)
Change in consolidation scope and other changes (183) 125 (308) 292 45 247
Net industrial cash flow (104) 1,756 (1,860) (899) 1,623 (2,522)
Capital increases and dividends (3) (6) 3 (36) - (36)
Currency translation differences 3 (38) 41 (81) (40) (41)
Change in net industrial debt (104) 1,712 (1,816) (1,016) 1,583 (2,599)
Net industrial (debt)/cash at end of year (6,649) 215 (6,864) (6,545) (1,497) (5,048)
(*) Figures for 2012 Annual Report have been restated to reflect application of the amendment to IAS 19 – Employee Benefits. Compared with the figures published in the
2012 financial statements, net profit was reduced by €515 million, of which €508 million related to Chrysler and €7 million to the Industrial Activities of Fiat excluding
Chrysler. Corresponding increases were recognized under “Changes in provisions and other changes”.
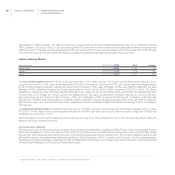
Net industrial debt increased €104 million for the year with €1.7 billion in cash generation for Chrysler almost fully compensating cash
absorption for Fiat excluding Chrysler. Net of equity investments, the Group generated approximately €0.1 billion in cash.
For Chrysler, there was a positive difference of €1,712 million, reflecting €5,204 million in cash from operating activities and €3,573 million in
capital expenditure for the year.
For Fiat excluding Chrysler, net industrial debt increased by €1,816 million, reflecting capital expenditure (€3,860 million compared with
€3,219 million in 2012) and equity investments and the change in scope of consolidation (included under “Change in consolidation scope and
other changes”), which were only partially compensated for by the €2,308 million cash generated from operating activities during the year.
(1) See “Key Performance Indicators” for a description of this measure.
Financial Review – Fiat Group