Chrysler 2013 Annual Report Download - page 204
Download and view the complete annual report
Please find page 204 of the 2013 Chrysler annual report below. You can navigate through the pages in the report by either clicking on the pages listed below, or by using the keyword search tool below to find specific information within the annual report.-
 1
1 -
2
-
3
-
4
-
5
-
6
-
7
-
8
-
9
-
10
-
11
-
12
-
13
-
14
-
15
-
16
-
17
-
18
-
19
-
20
-
21
-
22
-
23
-
24
-
25
-
26
-
27
-
28
-
29
-
30
-
31
-
32
-
33
-
34
-
35
-
36
-
37
-
38
-
39
-
40
-
41
-
42
-
43
-
44
-
45
-
46
-
47
-
48
-
49
-
50
-
51
-
52
-
53
-
54
-
55
-
56
-
57
-
58
-
59
-
60
-
61
-
62
-
63
-
64
-
65
-
66
-
67
-
68
-
69
-
70
-
71
-
72
-
73
-
74
-
75
-
76
-
77
-
78
-
79
-
80
-
81
-
82
-
83
-
84
-
85
-
86
-
87
-
88
-
89
-
90
-
91
-
92
-
93
-
94
-
95
-
96
-
97
-
98
-
99
-
100
-
101
-
102
-
103
-
104
-
105
-
106
-
107
-
108
-
109
-
110
-
111
-
112
-
113
-
114
-
115
-
116
-
117
-
118
-
119
-
120
-
121
-
122
-
123
-
124
-
125
-
126
-
127
-
128
-
129
-
130
-
131
-
132
-
133
-
134
-
135
-
136
-
137
-
138
-
139
-
140
-
141
-
142
-
143
-
144
-
145
-
146
-
147
-
148
-
149
-
150
-
151
-
152
-
153
-
154
-
155
-
156
-
157
-
158
-
159
-
160
-
161
-
162
-
163
-
164
-
165
-
166
-
167
-
168
-
169
-
170
-
171
-
172
-
173
-
174
-
175
-
176
-
177
-
178
-
179
-
180
-
181
-
182
-
183
-
184
-
185
-
186
-
187
-
188
-
189
-
190
-
191
-
192
-
193
-
 194
194 -
 195
195 -
 196
196 -
 197
197 -
 198
198 -
 199
199 -
 200
200 -
 201
201 -
 202
202 -
 203
203 -
 204
204 -
 205
205 -
 206
206 -
 207
207 -
 208
208 -
 209
209 -
 210
210 -
 211
211 -
 212
212 -
 213
213 -
 214
214 -
215
-
216
-
217
-
218
-
219
-
220
-
221
-
222
-
223
-
224
-
225
-
226
-
227
-
228
-
229
-
230
-
231
-
232
-
233
-
234
-
235
-
236
-
237
-
238
-
239
-
240
-
241
-
242
-
243
-
244
-
245
-
246
-
247
-
248
-
249
-
250
-
251
-
252
-
253
-
254
-
255
-
256
-
257
-
258
-
259
-
260
-
261
-
262
-
263
-
264
-
265
-
266
-
267
-
268
-
269
-
270
-
271
-
272
-
273
-
274
-
275
-
276
-
277
-
278
-
279
-
280
-
281
-
282
-
283
-
284
-
285
-
286
-
287
-
288
-
289
-
290
-
291
-
292
-
293
-
294
-
295
-
296
-
297
-
298
-
299
-
300
-
301
-
302
-
303
-
304
-
305
-
306
-
307
-
308
-
309
-
310
-
311
-
312
-
313
-
314
-
315
-
316
-
317
-
318
-
319
-
320
-
321
-
322
-
323
-
324
-
325
-
326
-
327
-
328
-
329
-
330
-
331
-
332
-
333
-
334
-
335
-
336
-
337
-
338
-
339
-
340
-
341
-
342
-
343
-
344
-
345
-
346
-
347
-
348
-
349
-
350
-
351
-
352
-
353
-
354
-
355
-
356
-
357
-
358
-
359
-
360
-
361
-
362
-
363
-
364
-
365
-
366
 |
 |

203
Consolidated
Financial Statements
at 31 December 2013
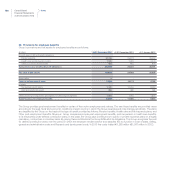
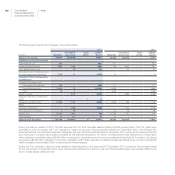
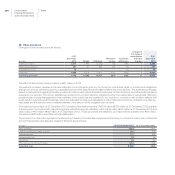
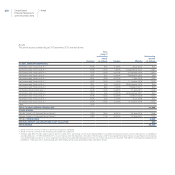
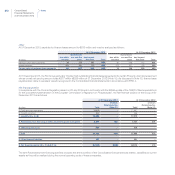
Changes in defined benefit obligations for other post-employment benefits are as follows:
(€ million) 2013 2012
Present value of obligations at 1 January 960 919
Included in Income statement
Current service cost 98
Interest expenses 15 24
Past service costs (credits) and gains or losses arising from settlements -(3)
Included in OCI
Actuarial losses (gains) from:
Demographic assumptions (1) (4)
Financial assumptions 34 51
Other 23 25
Effect of movements in exchange rates (4) 2
Other
Benefits paid (57) (76)
Change in the scope of consolidation 21 -
Other (16) 14
Present value of obligations at 31 December 984 960
The main assumptions used in developing the required estimates for other post- employment benefits include the discount rate, the retirement
or employee leaving rate and the mortality rates.
The discount rates used for the measurement of the Italian TFR obligation are based on yields of high-quality (AA rated) fixed income securities
for which the timing and amounts of payments match the timing and amounts of the projected benefit payments. For this plan, the single
weighted average discount rate that reflects the estimated timing and amount of the scheme future benefit payments for 2013 is equal to
2.77% (3.4% in 2012). The average duration of the Italian TFR is approximately 7 years. Retirement or employee leaving rates are developed
to reflect actual and projected Group experience and law requirements for retirement in Italy. The effect on the TFR obligation of 1% increase
or decrease in the assumed discount rate, holding all other assumption constant, is negative for €43 million and positive for €52 million
respectively.
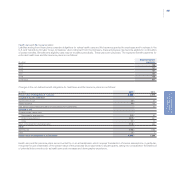
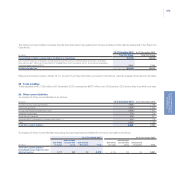
Other provisions for employees and liabilities for share based payments
At 31 December 2013, Other provisions for employees and liabilities for share based payments comprised other long term benefits obligations
for €332 million (€323 million at 31 December 2012), representing the expected obligation for benefits as jubilee and long term disability
granted to certain employees by the Group. This item also comprised Liabilities for share-based payments amounting to €123 million at 31
December 2013 (€125 million at 31 December 2012).