Chrysler 2013 Annual Report Download - page 57
Download and view the complete annual report
Please find page 57 of the 2013 Chrysler annual report below. You can navigate through the pages in the report by either clicking on the pages listed below, or by using the keyword search tool below to find specific information within the annual report.-
 1
1 -
2
-
3
-
4
-
5
-
6
-
7
-
8
-
9
-
10
-
11
-
12
-
13
-
14
-
15
-
16
-
17
-
18
-
19
-
20
-
21
-
22
-
23
-
24
-
25
-
26
-
27
-
28
-
29
-
30
-
31
-
32
-
33
-
34
-
35
-
36
-
37
-
38
-
39
-
40
-
41
-
42
-
43
-
44
-
45
-
46
-
 47
47 -
 48
48 -
 49
49 -
 50
50 -
 51
51 -
 52
52 -
 53
53 -
 54
54 -
 55
55 -
 56
56 -
 57
57 -
 58
58 -
 59
59 -
 60
60 -
 61
61 -
 62
62 -
 63
63 -
 64
64 -
 65
65 -
 66
66 -
 67
67 -
68
-
69
-
70
-
71
-
72
-
73
-
74
-
75
-
76
-
77
-
78
-
79
-
80
-
81
-
82
-
83
-
84
-
85
-
86
-
87
-
88
-
89
-
90
-
91
-
92
-
93
-
94
-
95
-
96
-
97
-
98
-
99
-
100
-
101
-
102
-
103
-
104
-
105
-
106
-
107
-
108
-
109
-
110
-
111
-
112
-
113
-
114
-
115
-
116
-
117
-
118
-
119
-
120
-
121
-
122
-
123
-
124
-
125
-
126
-
127
-
128
-
129
-
130
-
131
-
132
-
133
-
134
-
135
-
136
-
137
-
138
-
139
-
140
-
141
-
142
-
143
-
144
-
145
-
146
-
147
-
148
-
149
-
150
-
151
-
152
-
153
-
154
-
155
-
156
-
157
-
158
-
159
-
160
-
161
-
162
-
163
-
164
-
165
-
166
-
167
-
168
-
169
-
170
-
171
-
172
-
173
-
174
-
175
-
176
-
177
-
178
-
179
-
180
-
181
-
182
-
183
-
184
-
185
-
186
-
187
-
188
-
189
-
190
-
191
-
192
-
193
-
194
-
195
-
196
-
197
-
198
-
199
-
200
-
201
-
202
-
203
-
204
-
205
-
206
-
207
-
208
-
209
-
210
-
211
-
212
-
213
-
214
-
215
-
216
-
217
-
218
-
219
-
220
-
221
-
222
-
223
-
224
-
225
-
226
-
227
-
228
-
229
-
230
-
231
-
232
-
233
-
234
-
235
-
236
-
237
-
238
-
239
-
240
-
241
-
242
-
243
-
244
-
245
-
246
-
247
-
248
-
249
-
250
-
251
-
252
-
253
-
254
-
255
-
256
-
257
-
258
-
259
-
260
-
261
-
262
-
263
-
264
-
265
-
266
-
267
-
268
-
269
-
270
-
271
-
272
-
273
-
274
-
275
-
276
-
277
-
278
-
279
-
280
-
281
-
282
-
283
-
284
-
285
-
286
-
287
-
288
-
289
-
290
-
291
-
292
-
293
-
294
-
295
-
296
-
297
-
298
-
299
-
300
-
301
-
302
-
303
-
304
-
305
-
306
-
307
-
308
-
309
-
310
-
311
-
312
-
313
-
314
-
315
-
316
-
317
-
318
-
319
-
320
-
321
-
322
-
323
-
324
-
325
-
326
-
327
-
328
-
329
-
330
-
331
-
332
-
333
-
334
-
335
-
336
-
337
-
338
-
339
-
340
-
341
-
342
-
343
-
344
-
345
-
346
-
347
-
348
-
349
-
350
-
351
-
352
-
353
-
354
-
355
-
356
-
357
-
358
-
359
-
360
-
361
-
362
-
363
-
364
-
365
-
366
 |
 |

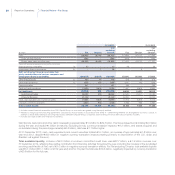
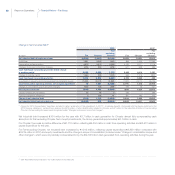
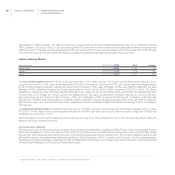
56 Report on Operations
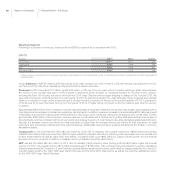
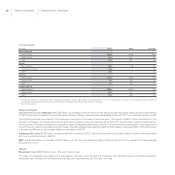
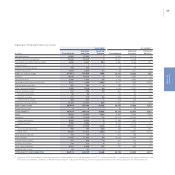
Operating Performance by Activity
2013 2012(*)
(€ million) Consolidated
Industrial
Activities
Financial
Services Consolidated
Industrial
Activities
Financial
Services
Net revenues 86,816 86,549 370 83,957 83,660 394
Cost of sales 74,570 74,362 311 71,701 71,527 271
Selling, general and administrative 6,689 6,642 47 6,763 6,719 44
Research and development 2,231 2,231 - 1,850 1,850 -
Other income/(expense) 68 64 4 (102) (113) 11
TRADING PROFIT/(LOSS) 3,394 3,378 16 3,541 3,451 90
Result from investments (**) 97 11 86 107 24 83
Gains/(losses) on disposal of investments 8 8 - (91) (91) -
Restructuring costs 28 28 - 15 15 -
Other unusual income/(expense) (499) (499) - (138) (138) -
EBIT 2,972 2,870 102 3,404 3,231 173
Financial income/(expense) (1,964) (1,964) - (1,885) (1,885) -
PROFIT/(LOSS) BEFORE TAXES 1,008 906 102 1,519 1,346 173
Income taxes (943) (954) 11 623 594 29
PROFIT/(LOSS) 1,951 1,860 91 896 752 144
Result from intersegment investments - 91 - - 144 -
PROFIT/(LOSS) 1,951 1,951 91 896 896 144
(*) Figures for 2012 have been restated to reflect application of the amendment to IAS 19. Compared with the figures previously reported for the Group and for Industrial
Activities, restatement resulted in a reduction in net profit of €515 million, reflecting a €273 million increase in operating expense, a €244 million increase in financial
expense and a €2 million decrease in income taxes.
(**) Includes income from investments, as well as impairment (losses)/reversals on non-intersegment investments accounted for using the equity method.
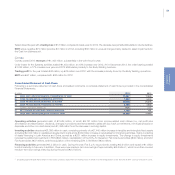
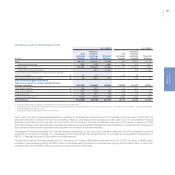
Industrial Activities
Net revenues for Industrial Activities totaled €86.5 billion, up 3% over the prior year, with growth in NAFTA and APAC more than offsetting
contractions in LATAM and EMEA. Luxury Brands posted a strong year-over-year increase, with Maserati more than doubling over the prior
year.
Trading profit totaled €3,378 million for the year (€3,451 million for 2012, restated for IAS 19 as amended). For 2013, R&D amortization
was €0.3 billion higher mainly due to new product launches in NAFTA. The reduction in losses for EMEA, strong increase for Luxury Brands –
including Maserati’s trading profit more than triple the 2012 level – as well as the positive contribution from Components were more than offset
by lower trading profit for NAFTA and LATAM.
Financial Review – Fiat Group