Chrysler 2013 Annual Report Download - page 314
Download and view the complete annual report
Please find page 314 of the 2013 Chrysler annual report below. You can navigate through the pages in the report by either clicking on the pages listed below, or by using the keyword search tool below to find specific information within the annual report.-
 1
1 -
 2
2 -
 3
3 -
 4
4 -
 5
5 -
 6
6 -
 7
7 -
 8
8 -
 9
9 -
 10
10 -
 11
11 -
 12
12 -
 13
13 -
 14
14 -
 15
15 -
 16
16 -
 17
17 -
 18
18 -
 19
19 -
 20
20 -
 21
21 -
 22
22 -
 23
23 -
 24
24 -
 25
25 -
 26
26 -
 27
27 -
 28
28 -
 29
29 -
 30
30 -
 31
31 -
 32
32 -
 33
33 -
 34
34 -
 35
35 -
 36
36 -
 37
37 -
 38
38 -
 39
39 -
 40
40 -
 41
41 -
 42
42 -
 43
43 -
 44
44 -
 45
45 -
 46
46 -
 47
47 -
 48
48 -
 49
49 -
 50
50 -
 51
51 -
 52
52 -
 53
53 -
 54
54 -
 55
55 -
 56
56 -
 57
57 -
 58
58 -
 59
59 -
 60
60 -
 61
61 -
 62
62 -
 63
63 -
 64
64 -
 65
65 -
 66
66 -
 67
67 -
 68
68 -
 69
69 -
 70
70 -
 71
71 -
 72
72 -
 73
73 -
 74
74 -
 75
75 -
 76
76 -
 77
77 -
 78
78 -
 79
79 -
 80
80 -
 81
81 -
 82
82 -
 83
83 -
 84
84 -
 85
85 -
 86
86 -
 87
87 -
 88
88 -
 89
89 -
 90
90 -
 91
91 -
 92
92 -
 93
93 -
 94
94 -
 95
95 -
 96
96 -
 97
97 -
 98
98 -
 99
99 -
 100
100 -
 101
101 -
 102
102 -
 103
103 -
 104
104 -
 105
105 -
 106
106 -
 107
107 -
 108
108 -
 109
109 -
 110
110 -
 111
111 -
 112
112 -
 113
113 -
 114
114 -
 115
115 -
 116
116 -
 117
117 -
 118
118 -
 119
119 -
 120
120 -
 121
121 -
 122
122 -
 123
123 -
 124
124 -
 125
125 -
 126
126 -
 127
127 -
 128
128 -
 129
129 -
 130
130 -
 131
131 -
 132
132 -
 133
133 -
 134
134 -
 135
135 -
 136
136 -
 137
137 -
 138
138 -
 139
139 -
 140
140 -
 141
141 -
 142
142 -
 143
143 -
 144
144 -
 145
145 -
 146
146 -
 147
147 -
 148
148 -
 149
149 -
 150
150 -
 151
151 -
 152
152 -
 153
153 -
 154
154 -
 155
155 -
 156
156 -
 157
157 -
 158
158 -
 159
159 -
 160
160 -
 161
161 -
 162
162 -
 163
163 -
 164
164 -
 165
165 -
 166
166 -
 167
167 -
 168
168 -
 169
169 -
 170
170 -
 171
171 -
 172
172 -
 173
173 -
 174
174 -
 175
175 -
 176
176 -
 177
177 -
 178
178 -
 179
179 -
 180
180 -
 181
181 -
 182
182 -
 183
183 -
 184
184 -
 185
185 -
 186
186 -
 187
187 -
 188
188 -
 189
189 -
 190
190 -
 191
191 -
 192
192 -
 193
193 -
 194
194 -
 195
195 -
 196
196 -
 197
197 -
 198
198 -
 199
199 -
 200
200 -
 201
201 -
 202
202 -
 203
203 -
 204
204 -
 205
205 -
 206
206 -
 207
207 -
 208
208 -
 209
209 -
 210
210 -
 211
211 -
 212
212 -
 213
213 -
 214
214 -
 215
215 -
 216
216 -
 217
217 -
 218
218 -
 219
219 -
 220
220 -
 221
221 -
 222
222 -
 223
223 -
 224
224 -
 225
225 -
 226
226 -
 227
227 -
 228
228 -
 229
229 -
 230
230 -
 231
231 -
 232
232 -
 233
233 -
 234
234 -
 235
235 -
 236
236 -
 237
237 -
 238
238 -
 239
239 -
 240
240 -
 241
241 -
 242
242 -
 243
243 -
 244
244 -
 245
245 -
 246
246 -
 247
247 -
 248
248 -
 249
249 -
 250
250 -
 251
251 -
 252
252 -
 253
253 -
 254
254 -
 255
255 -
 256
256 -
 257
257 -
 258
258 -
 259
259 -
 260
260 -
 261
261 -
 262
262 -
 263
263 -
 264
264 -
 265
265 -
 266
266 -
 267
267 -
 268
268 -
 269
269 -
 270
270 -
 271
271 -
 272
272 -
 273
273 -
 274
274 -
 275
275 -
 276
276 -
 277
277 -
 278
278 -
 279
279 -
 280
280 -
 281
281 -
 282
282 -
 283
283 -
 284
284 -
 285
285 -
 286
286 -
 287
287 -
 288
288 -
 289
289 -
 290
290 -
 291
291 -
 292
292 -
 293
293 -
 294
294 -
 295
295 -
 296
296 -
 297
297 -
 298
298 -
 299
299 -
 300
300 -
 301
301 -
 302
302 -
 303
303 -
 304
304 -
 305
305 -
 306
306 -
 307
307 -
 308
308 -
 309
309 -
 310
310 -
 311
311 -
 312
312 -
 313
313 -
 314
314 -
 315
315 -
 316
316 -
 317
317 -
 318
318 -
 319
319 -
 320
320 -
 321
321 -
 322
322 -
 323
323 -
 324
324 -
 325
325 -
 326
326 -
 327
327 -
 328
328 -
 329
329 -
 330
330 -
 331
331 -
 332
332 -
 333
333 -
 334
334 -
 335
335 -
 336
336 -
 337
337 -
 338
338 -
 339
339 -
 340
340 -
 341
341 -
 342
342 -
 343
343 -
 344
344 -
 345
345 -
 346
346 -
 347
347 -
 348
348 -
 349
349 -
 350
350 -
 351
351 -
 352
352 -
 353
353 -
 354
354 -
 355
355 -
 356
356 -
 357
357 -
 358
358 -
 359
359 -
 360
360 -
 361
361 -
 362
362 -
 363
363 -
 364
364 -
 365
365 -
 366
366
 |
 |

313
Fiat S.p.A. Statutory
Financial Statements
at 31 December 2013
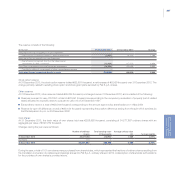
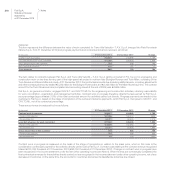
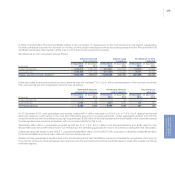
Current service costs for employees are recognized in the income statement under personnel costs (see Note 5) and for the Chief Executive
Officer under other operating costs (see Note 6). The associated interest costs are recognized in the income statement under financial
income/(expense) (see Note 7).
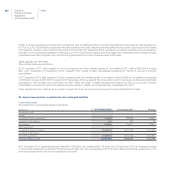
As defined benefit plan liabilities are measured on an actuarial basis, the recognized value of those liabilities is sensitive to the underlying
assumptions. The principal assumptions used in calculation of trattamento di fine rapporto (leaving entitlement or “TFR” in Italy) are the discount
rate, average rate of annual departures and maximum retirement age.
The discount rate used in measurement of the TFR liability is based on the current yield for investment grade fixed income securities of
equivalent maturity and amount as the expected future payments. For 2013, the average discount rate, which reflected the estimated timing
and amount of future plan payments, was 2.49%. The average duration of the TFR liability at year end was 4.39 years. The average annual rate
of departures, based on the Group’s prior experience, was estimated at 8.30%. The maximum retirement age was based on current legislation.
Maintaining all other assumptions unchanged, a 100 basis point increase or decrease in the discount rate would result in a €197 thousand
decrease or a €233 thousand increase, respectively, in the estimated value of the TFR liability.
The Company’s estimate of timing of future TFR payments is as follows: €1,213 thousand in 2014, €585 thousand in 2015, €420 thousand
in 2016, €496 thousand in 2017, €364 thousand in 2018 and €1,545 thousand for 2019 through 2024.
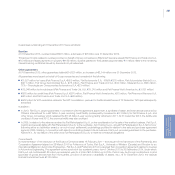
Other long-term employee benefits
At 31 December 2013, this item totaled €1,041 thousand (€1,640 thousand at 31 December 2012). That amount represents benefits payable
to employees who have completed a determined length of service based on a supplemental company agreement. Actuarial gains and losses
on the associated liability are recognized in the income statement in the period in which they arise.
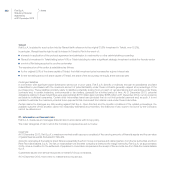
Provisions for stock option and stock grant plans
At 31 December 2013, this item totaled €123,216 thousand and represented the liability arising from the obligation, following the demerger of
activities to Fiat Industrial S.p.A. in January 2011, to deliver Fiat Industrial S.p.A. (now CNH Industrial N.V.) common shares to service a portion
of the Company’s stock option and stock grant plans.
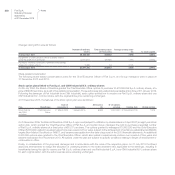
Changes in provisions for stock option and stock grant plans for the year were as follows:
(€ thousand)
31 December
2012
Fair value
adjustment Utilizations Other changes
31 December
2013
Provisions for stock option and stock grant plans 124,947 796 (2,138) (389) 123,216
In accordance with IFRS 2 and IAS 39, these liabilities were recognized at fair value upon initial recognition. In relation to the 2004 and 2006
stock option plans for the CEO and the 2006 stock option plan for managers, the calculation of fair value assumes a strike price equivalent to
the par value of Fiat Industrial shares at the balance sheet date. Subsequent to initial recognition, changes in fair value are recognized through
the income statement. In 2013, changes in fair value resulted in recognition, through the income statement, of a €796 thousand increase
in the liability with a corresponding increase in the value of the investment in CNH Industrial (see Note 11). Finally, utilizations during the year
(€2,138 thousand) related to CNH Industrial shares sold following the exercise of 285,000 options under the November 2006 stock option
plan for managers.
